Virti Analytics allows you to collect behavior, decision-making, sentiment analysis data and valuable insights that act as leading indicators for achieving learning-driven business outcomes. In this guide we'll show you the basics of how to access analytics, and in the following guides, do a deeper dive into all of the data you now have at your finger tips.
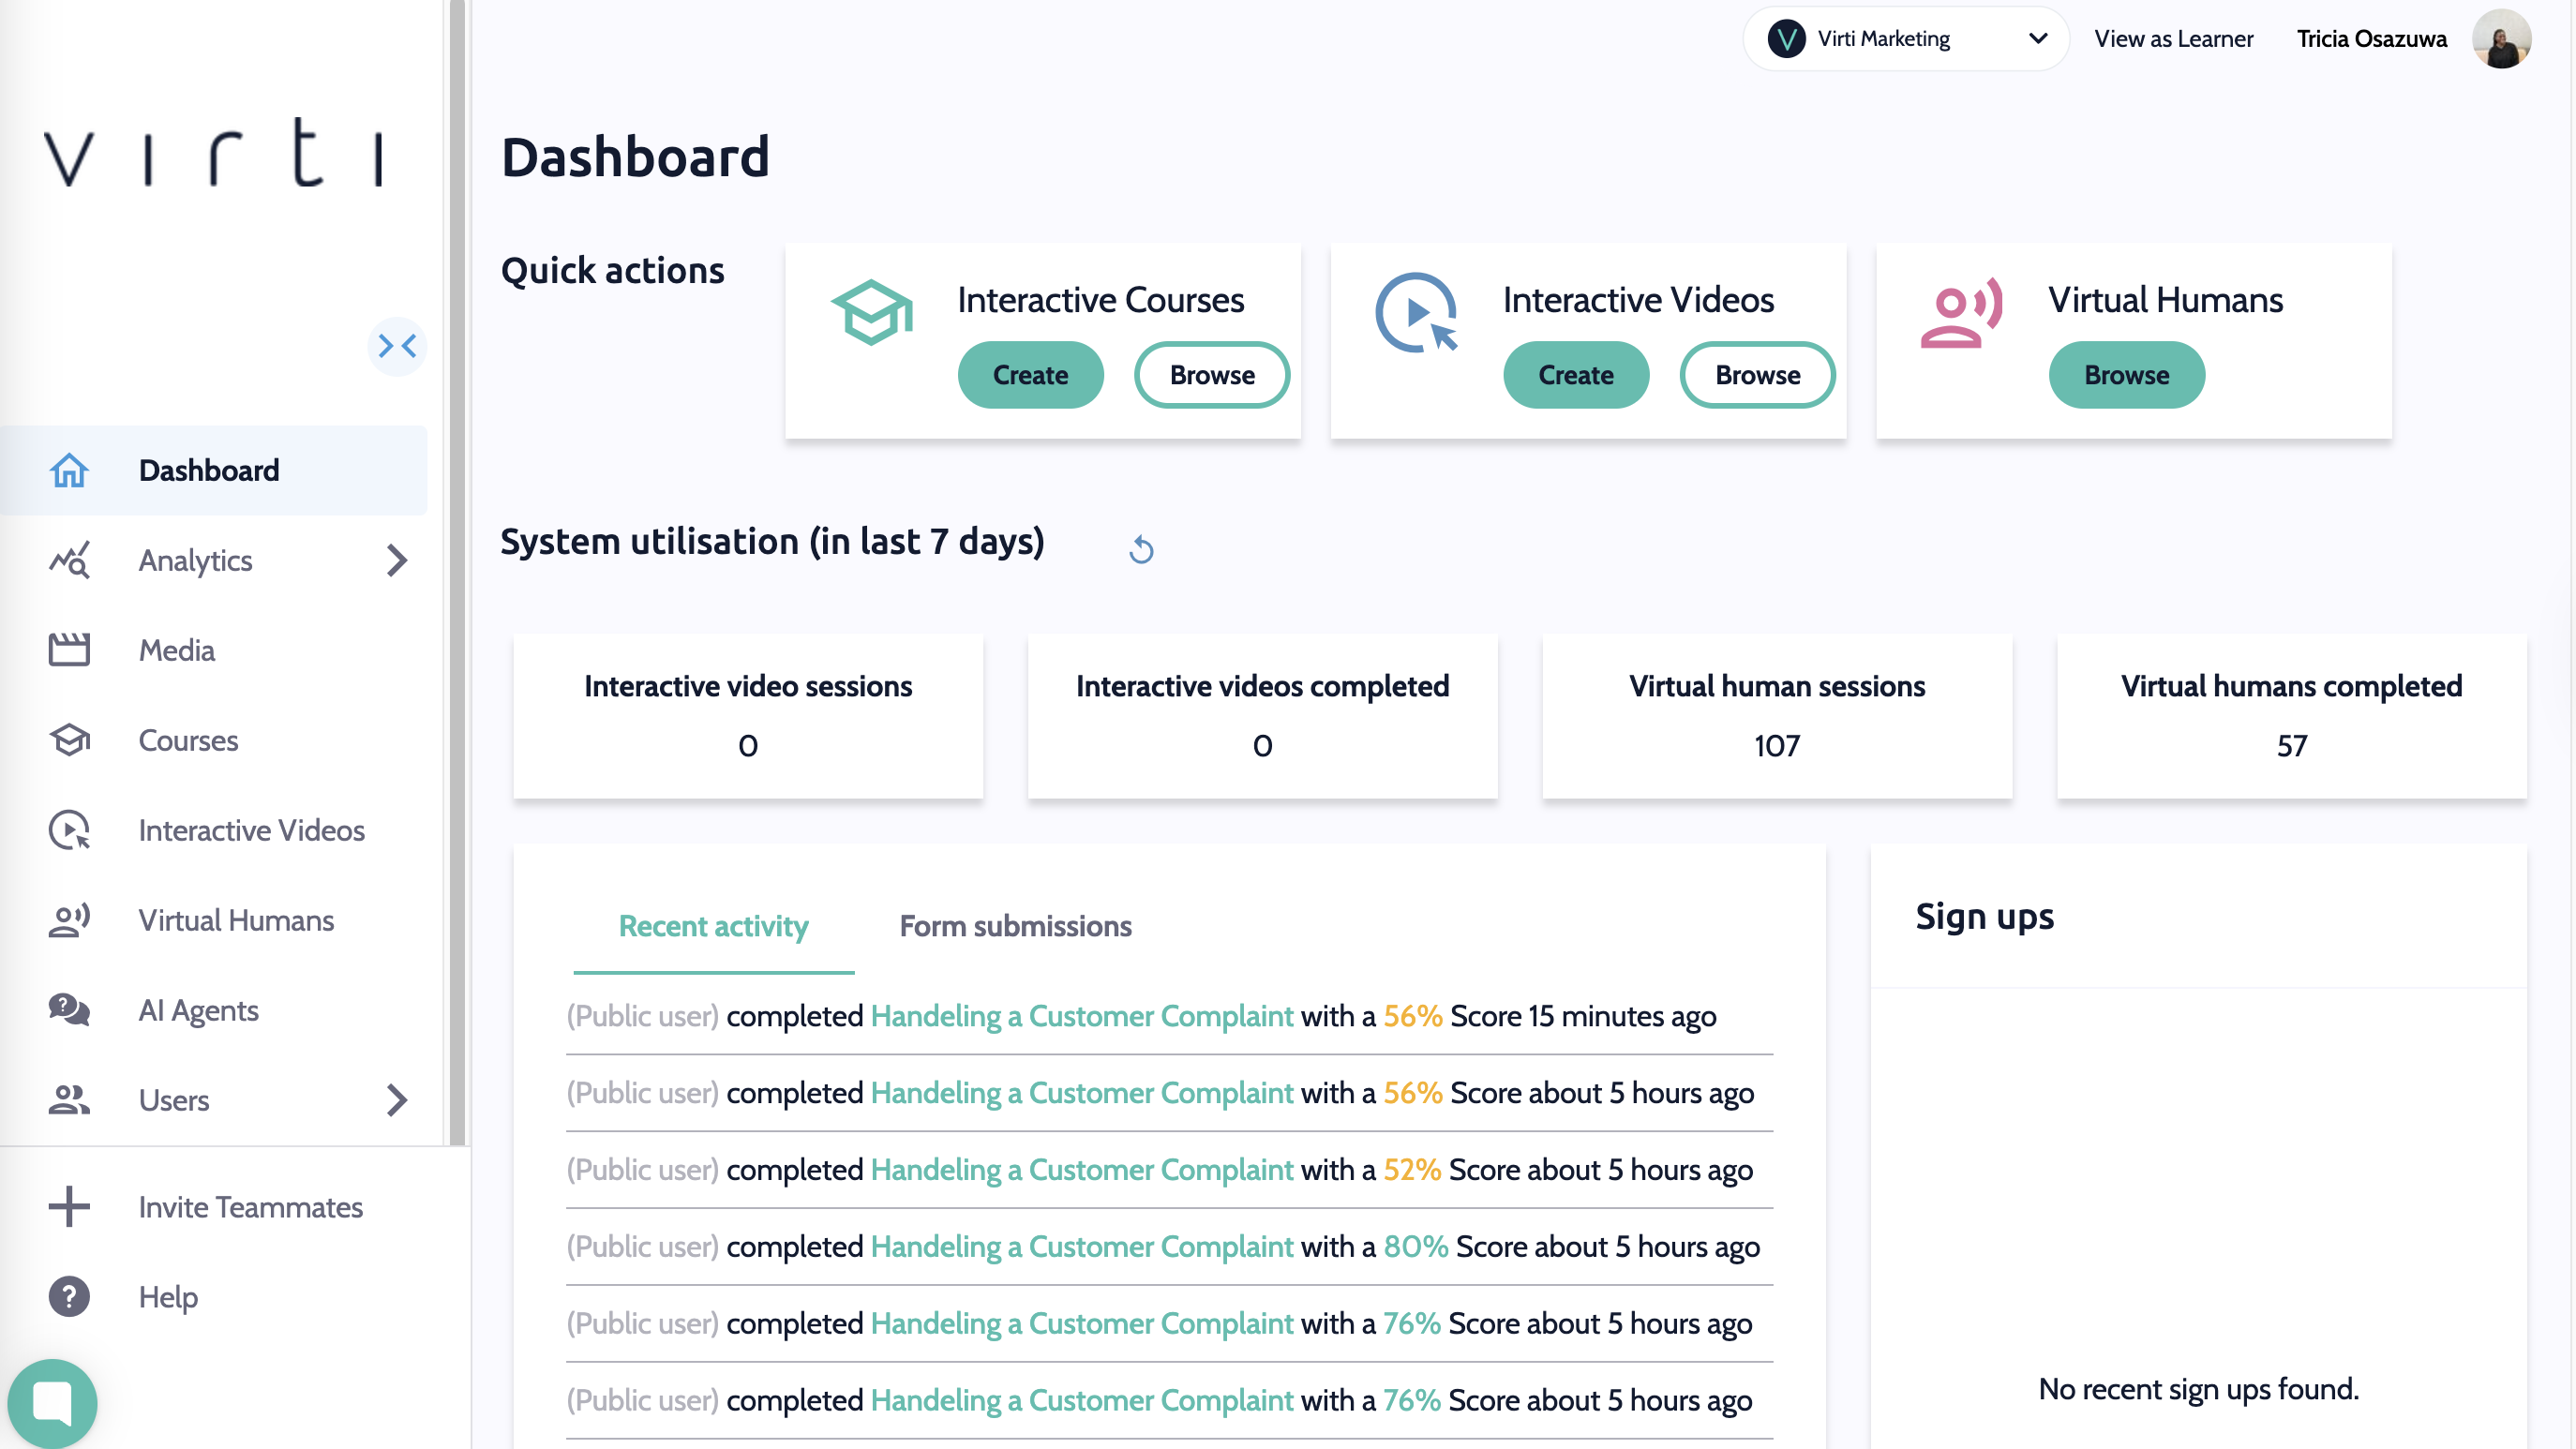
The dashboard gives you a quick look at recent activity in your organization, such as session completions, form submissions and sign ups.
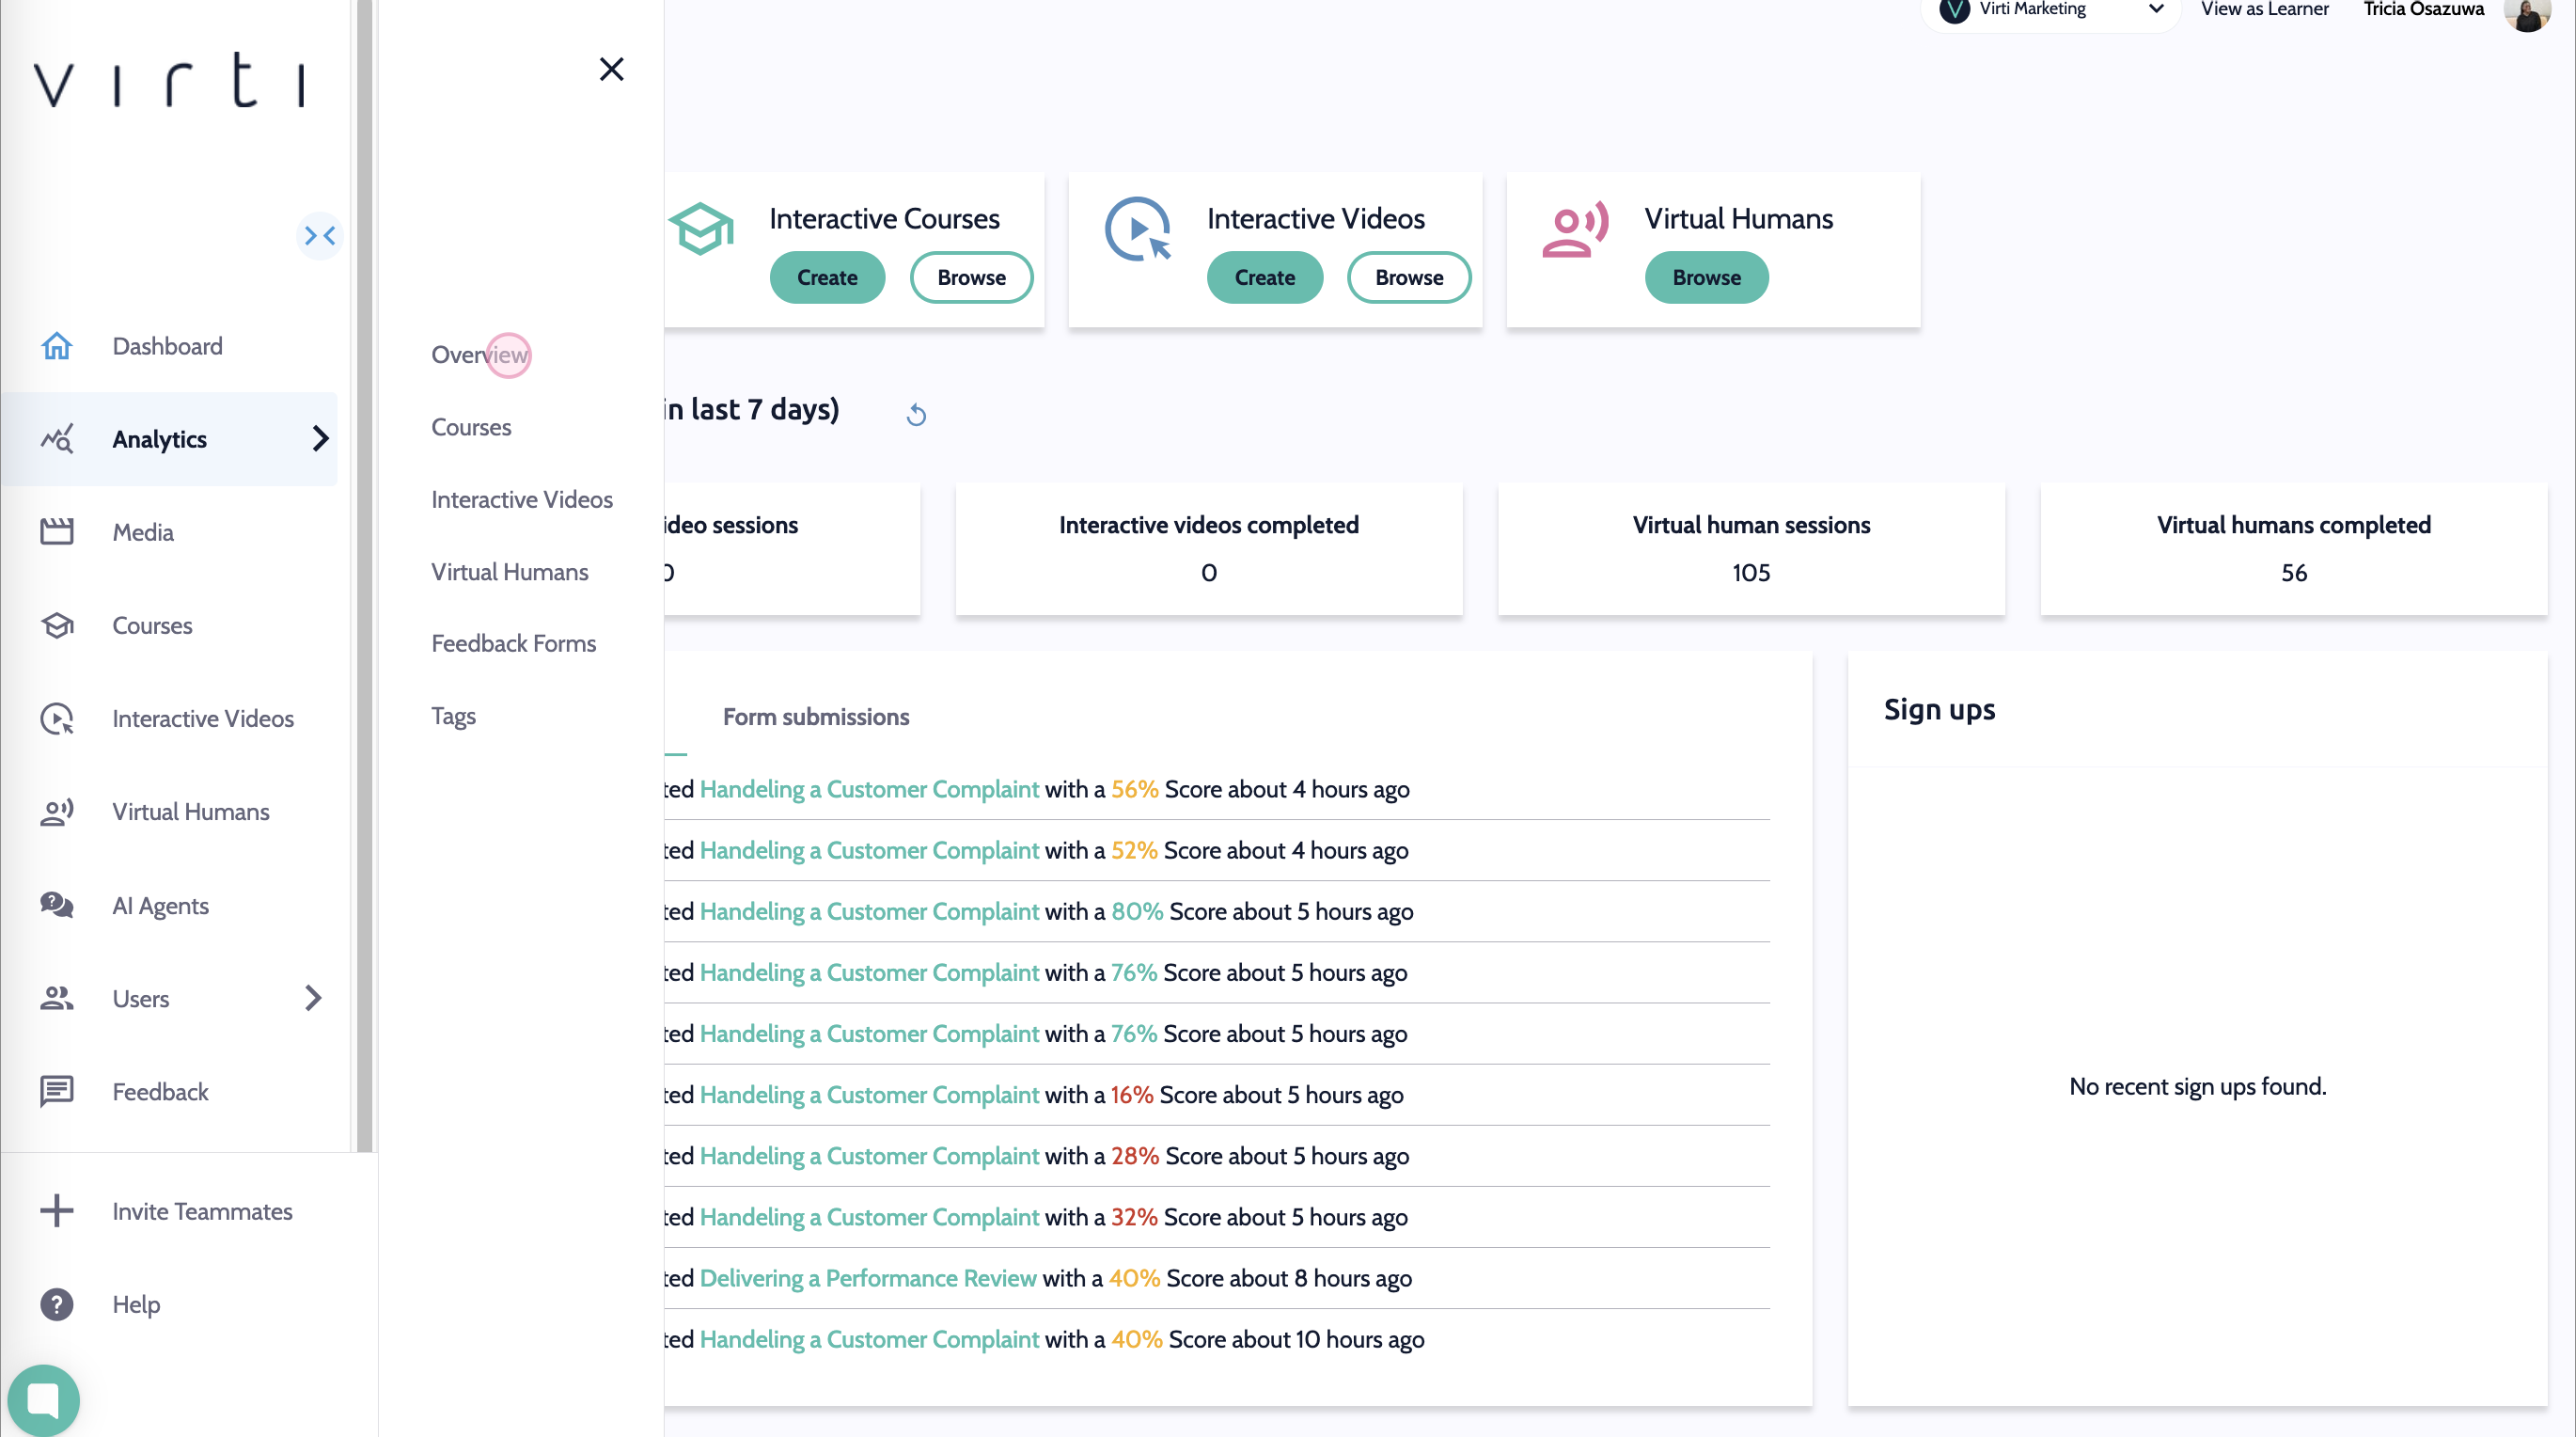
Begin by selecting analytics, to view analytics for your overall organization, Simulations, Courses, Virtual Humans, Feedback Forms, and Tags.
Click Overall to display a snapshot of usage & performance data across your organization.
Click Simulations to see high level data on all of your interactive video simulations, and click into one to dive deeper.
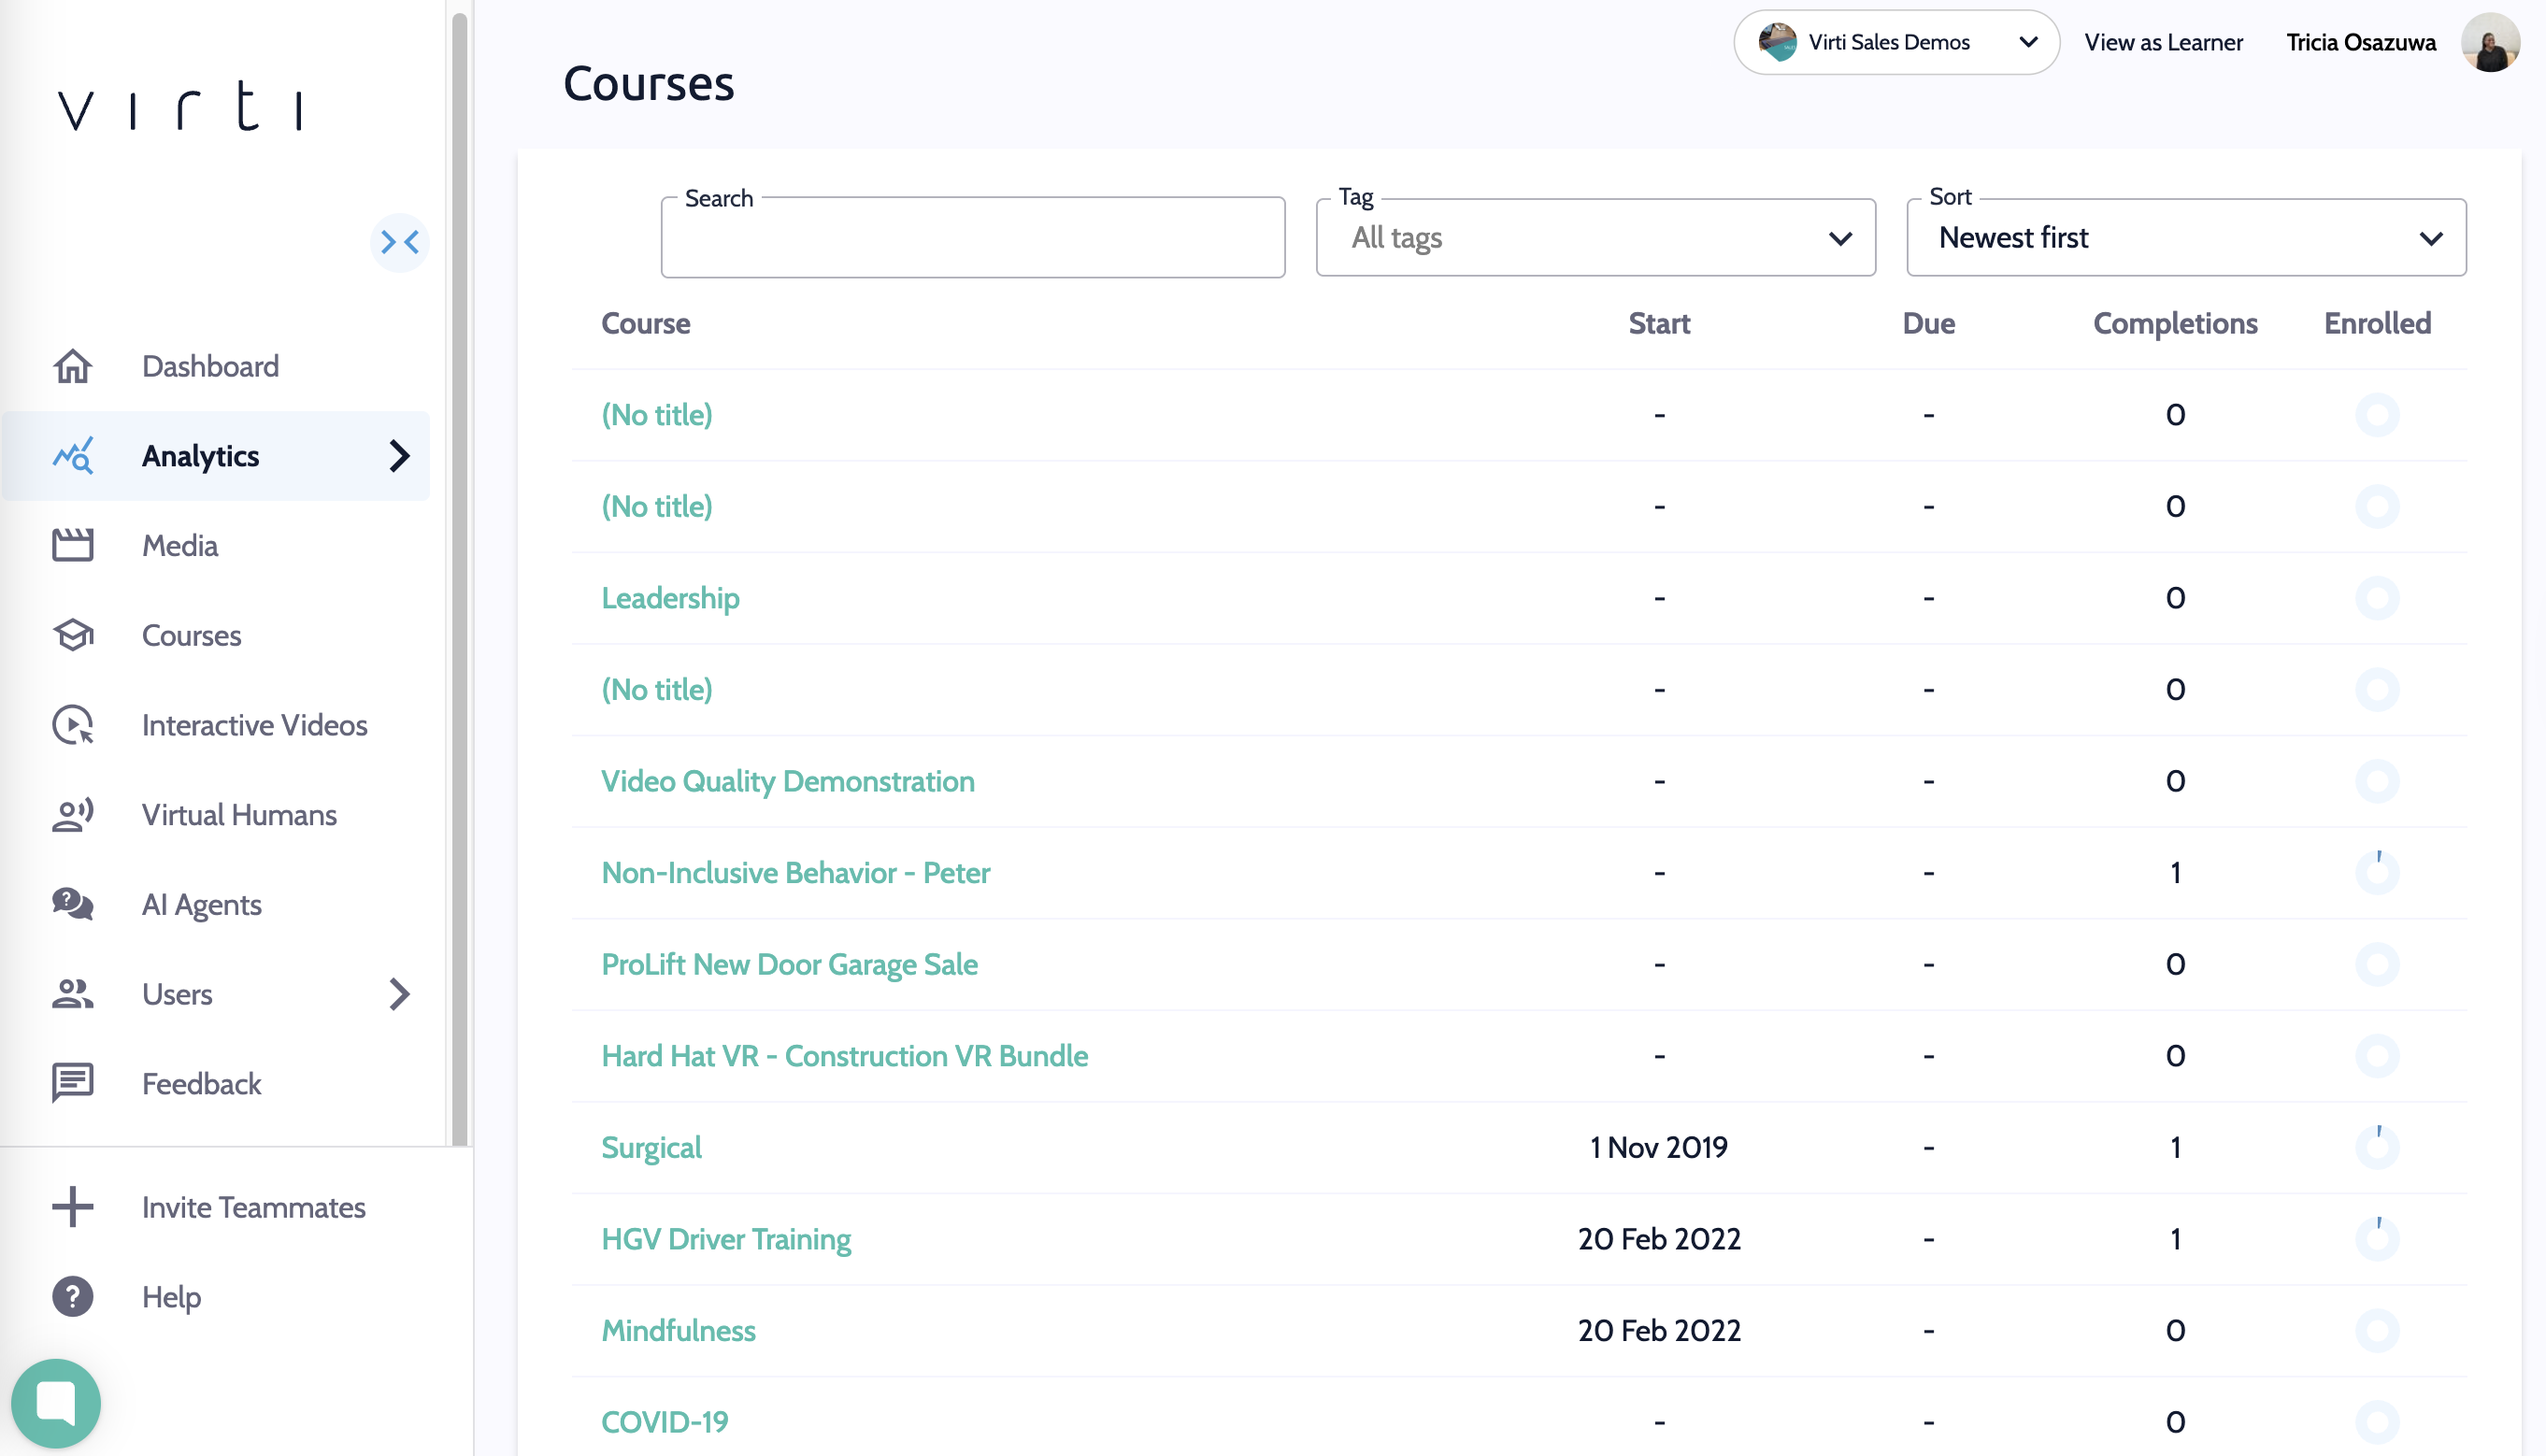
Click Courses where you can see how your learners are progressing through your courses.
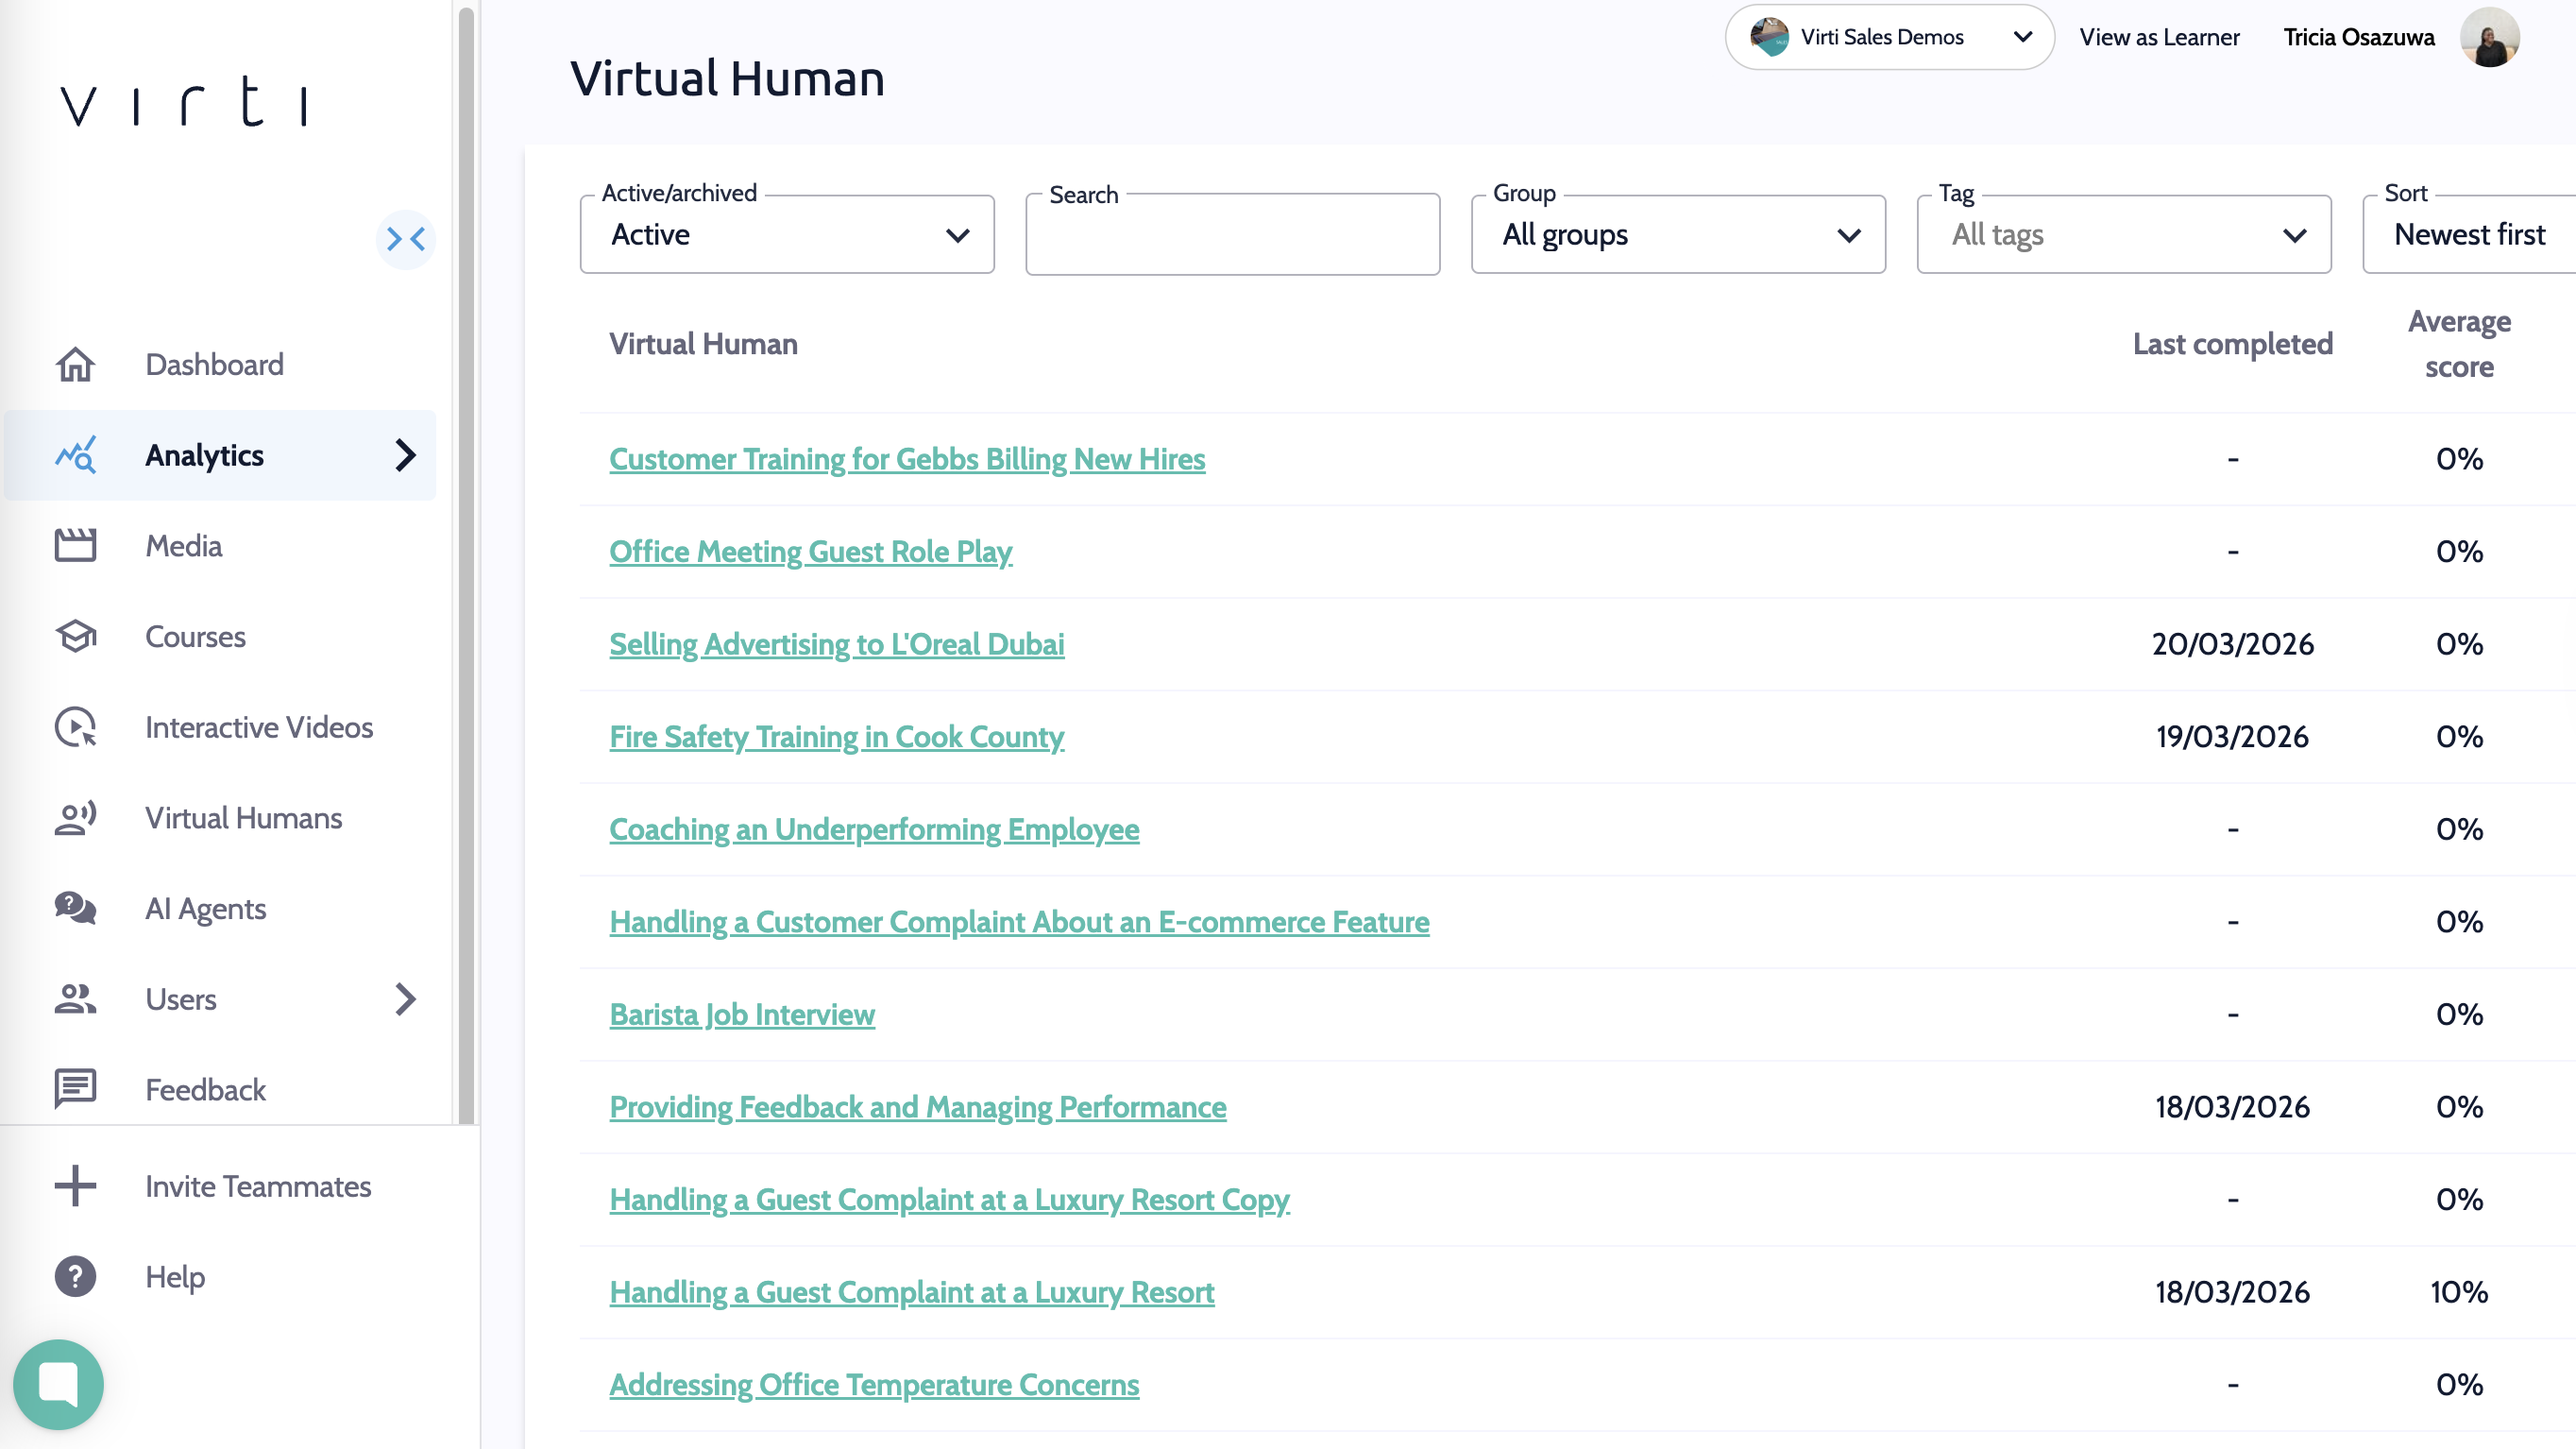
Click Virtual Humans to see how your learners are doing with their role play scenarios
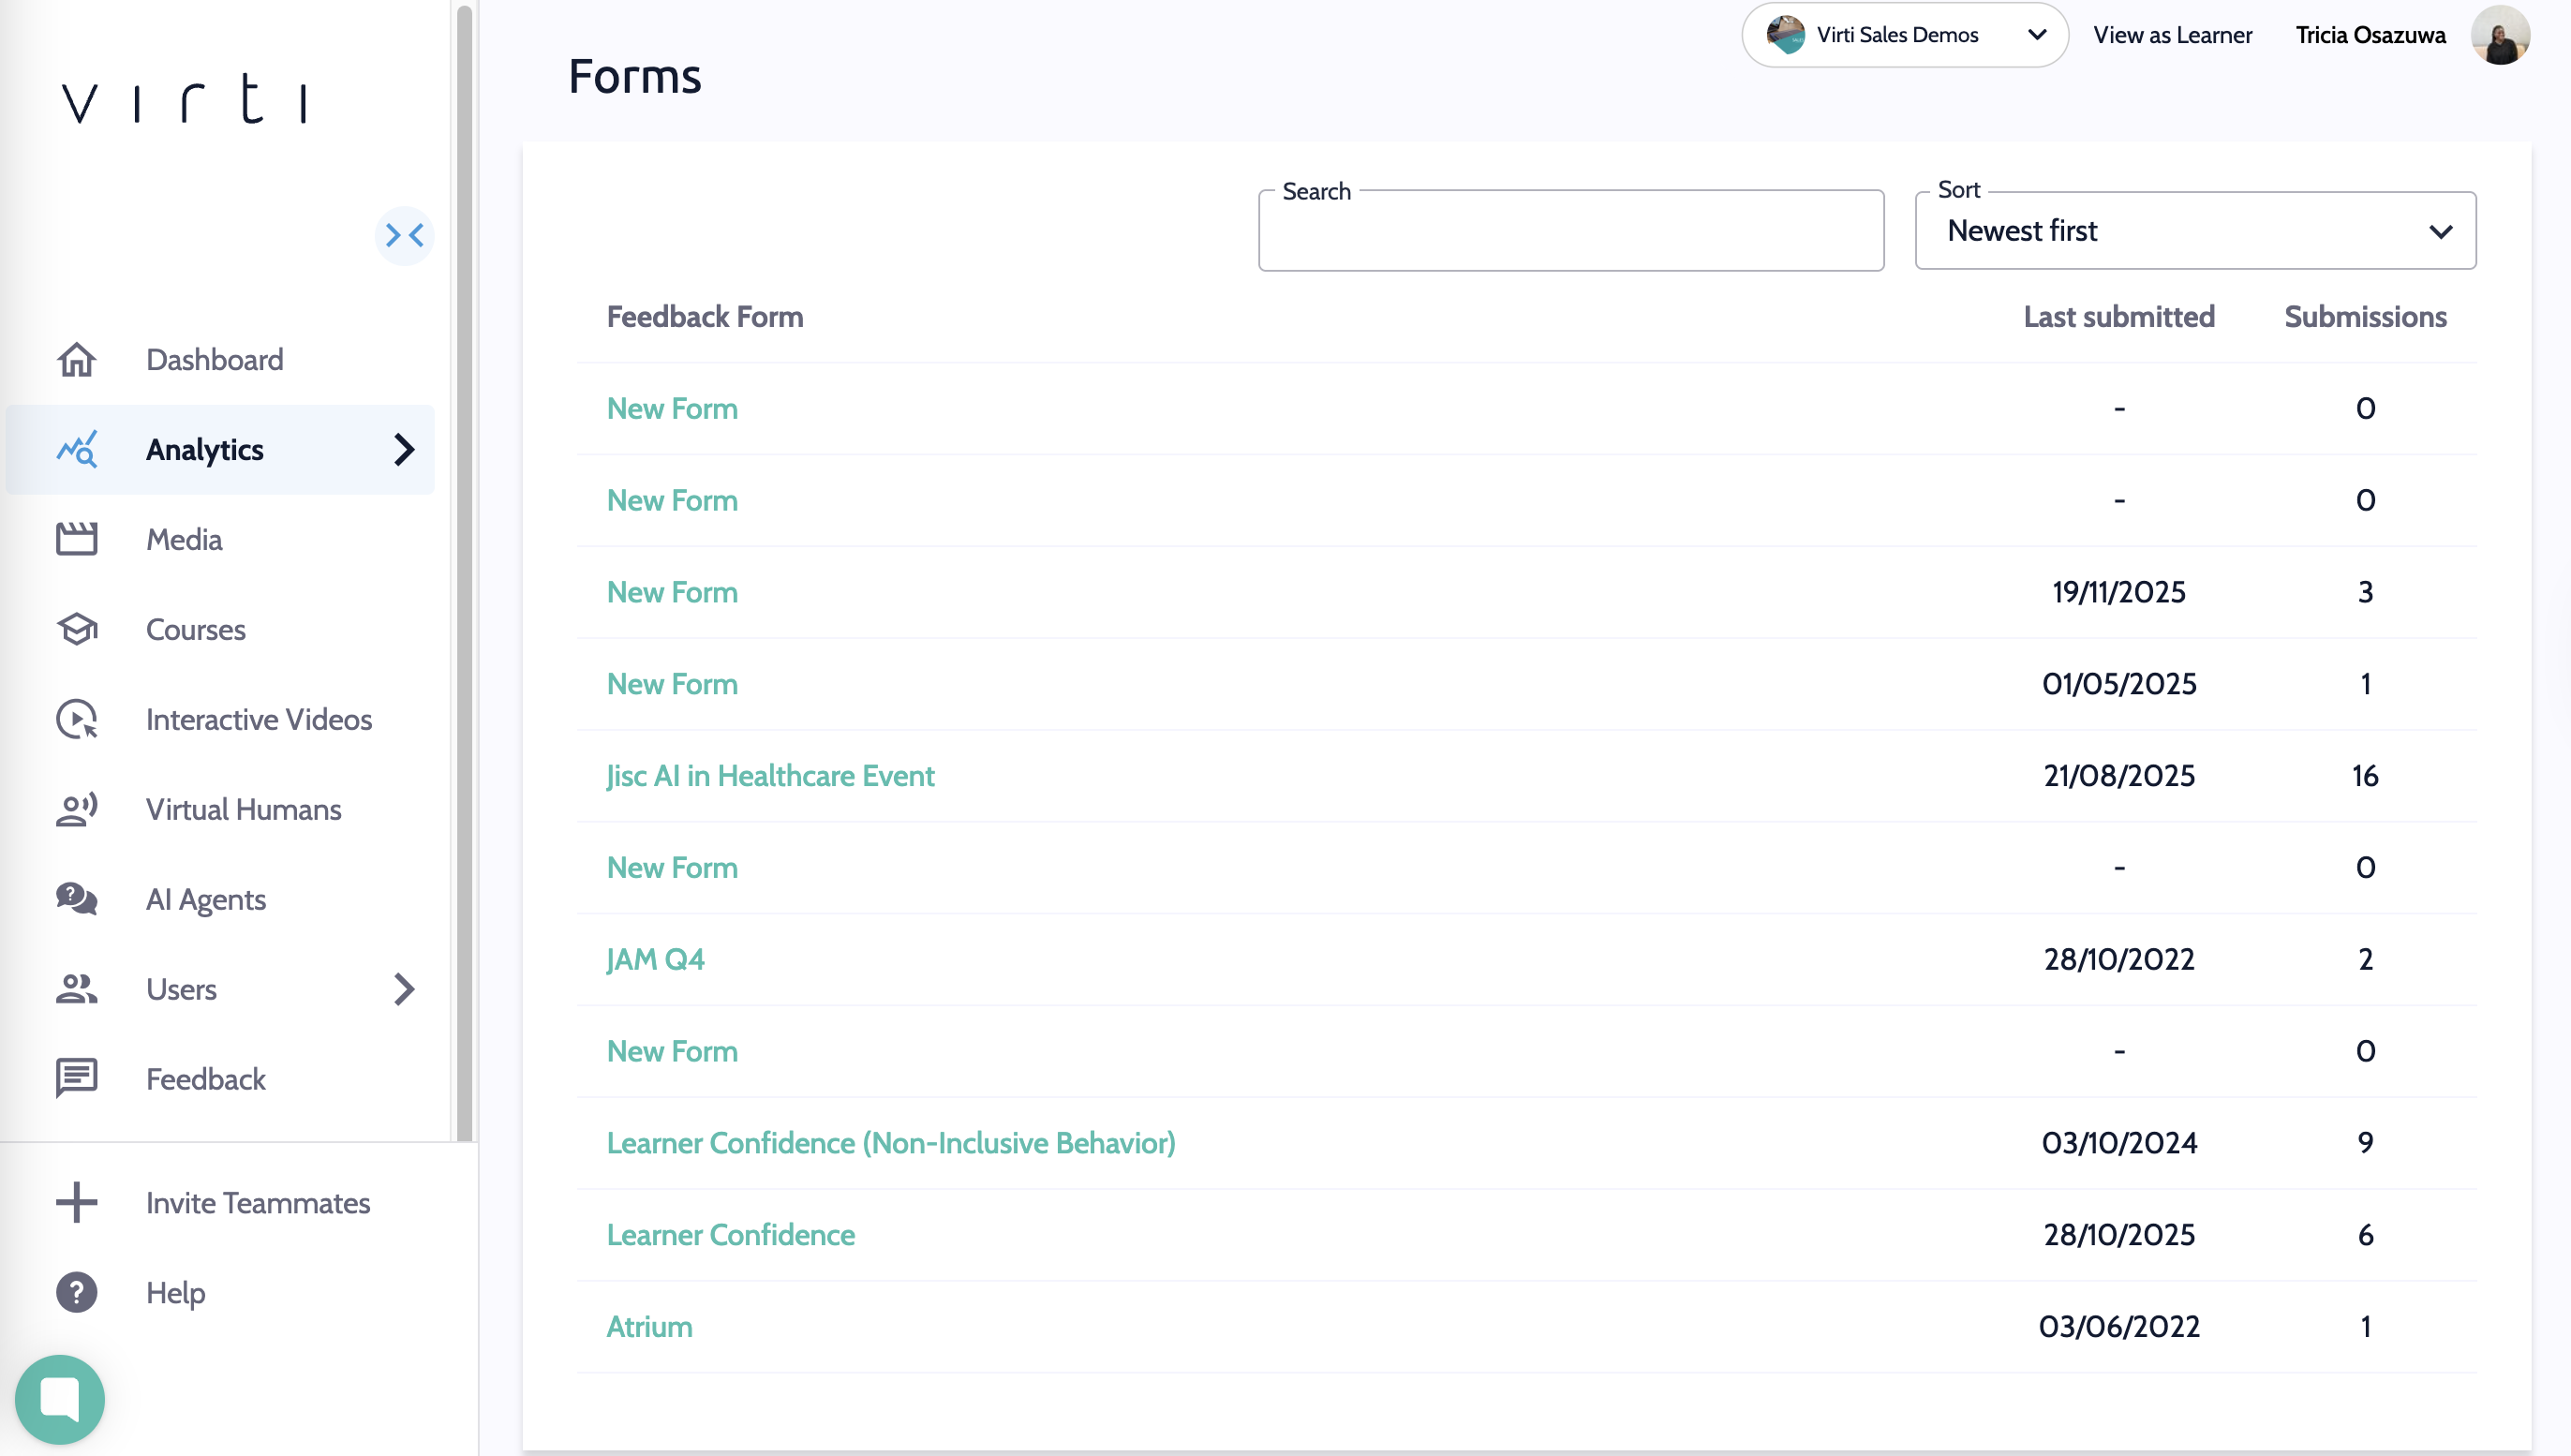
Click Feedback Forms to view all of the feedback data you have collected from your learners.
To dive deeper in to your data check out these guides:
Need more help? Contact [email protected]