Immersive 360 video simulations offer a rich source of data to elevate training and assessment programs. With these simulations, you can gather data on user engagement, attention focus, decision making, and knowledge checks. By analyzing this information, you can pinpoint specific skills, behaviors, and decision-making processes. This enables you to customize training modules, provide targeted feedback, and track improvement over time. The immersive nature of 360 video simulations ensures realistic and comprehensive learning experiences, helping users develop practical skills and confidence in a controlled, risk-free environment.
In the Performance tab you will find useful data about how your students are interacting. You will be able to see how many students have attempted and completed the training, as well as how long they have spent in the session.
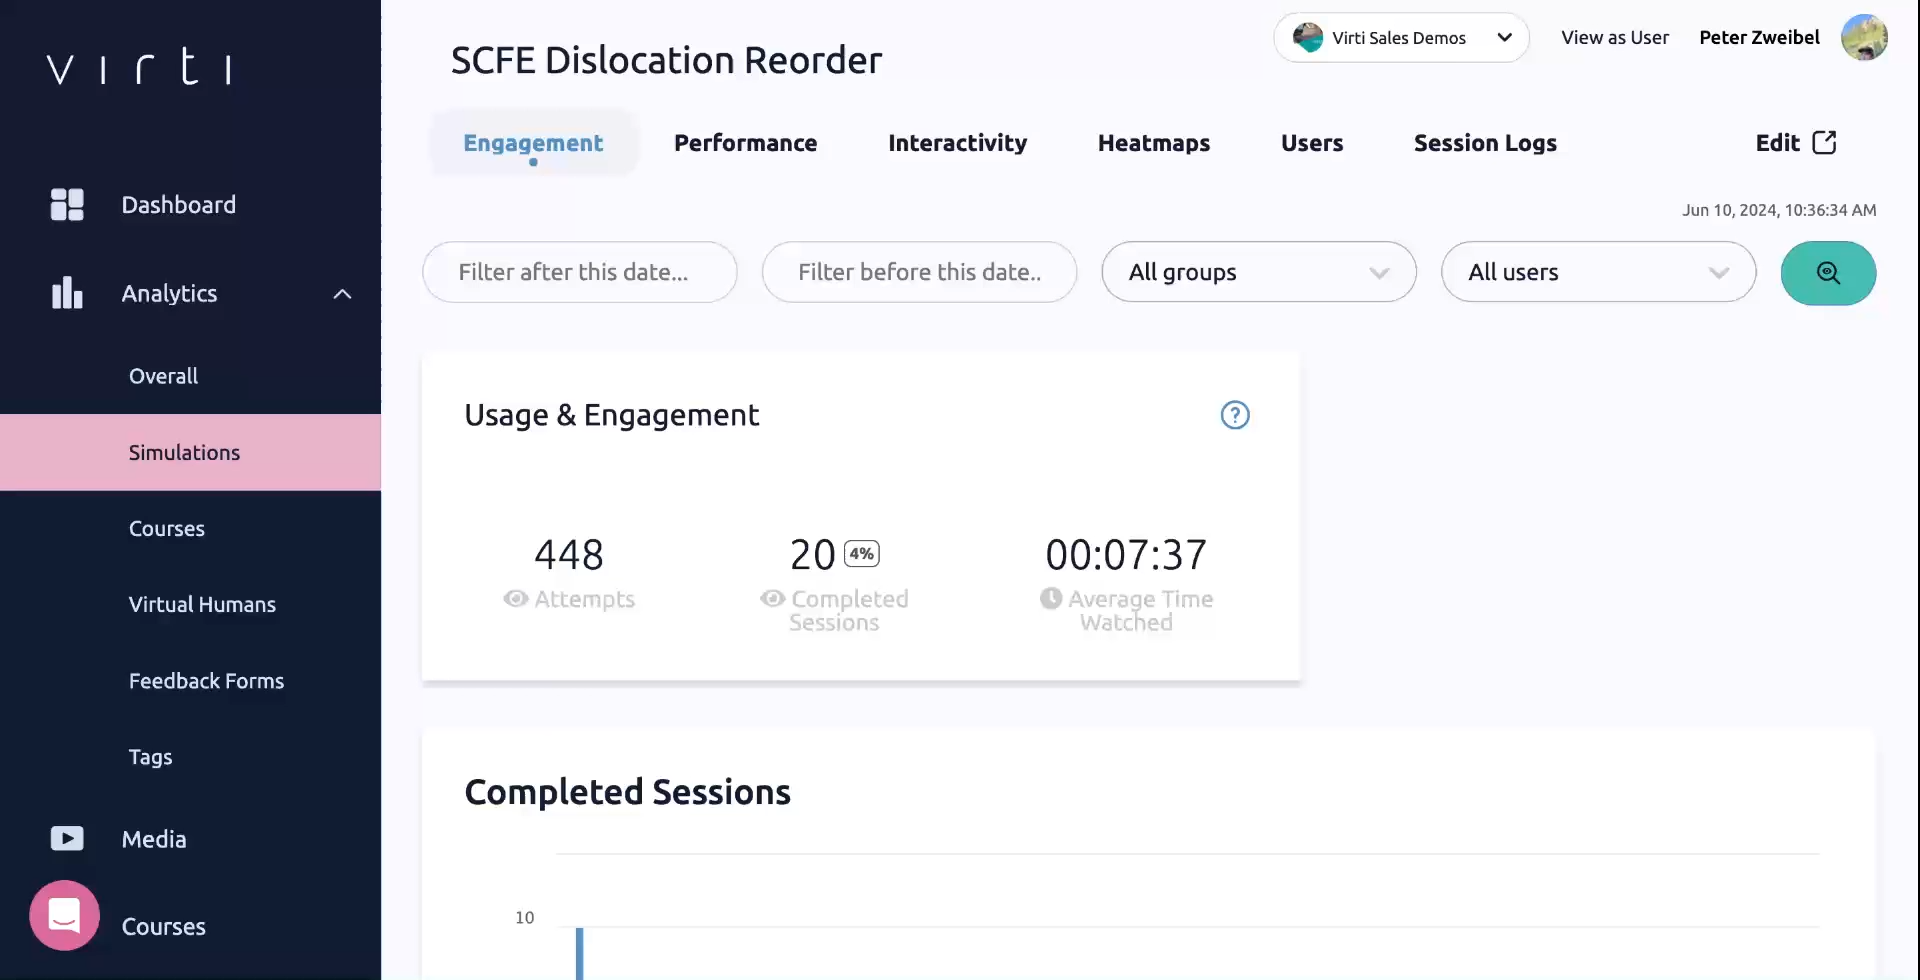
Tip: If your completion rate is low, there may be an issue with your scenario, or it may be too long, causing learners to exit before completing it.
Tip: If your average time watched is low, you may find that learners are progressing too quickly, either skipping through, or that the scenario is too easy.
If you are using your scenario as an assessment, and have including a scoring system. In the Performance tab you will find useful high level data about how your students are performing during your training.
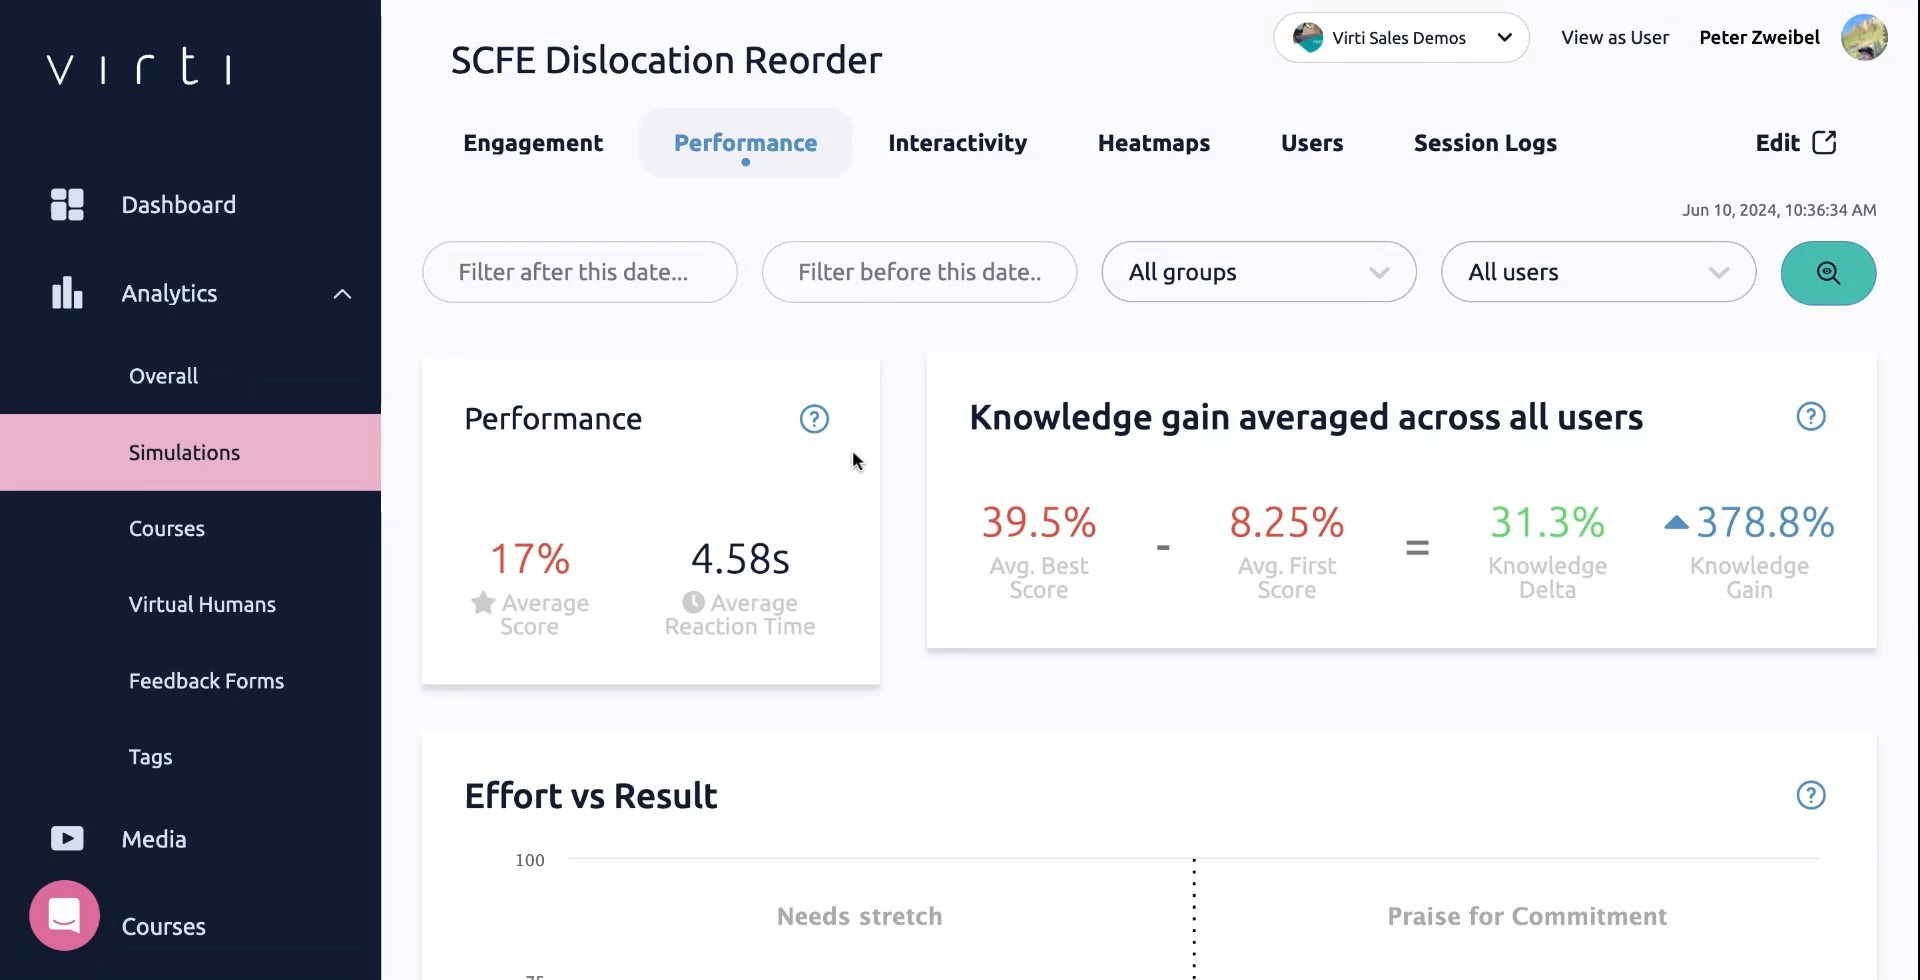
The Average Score, will show you the total average score received across the learners who completed the training.
Knowledge gain shows you the average difference between the best score your learners received and the first score they received. This shows how much better your learners are performing after multiple attempts.
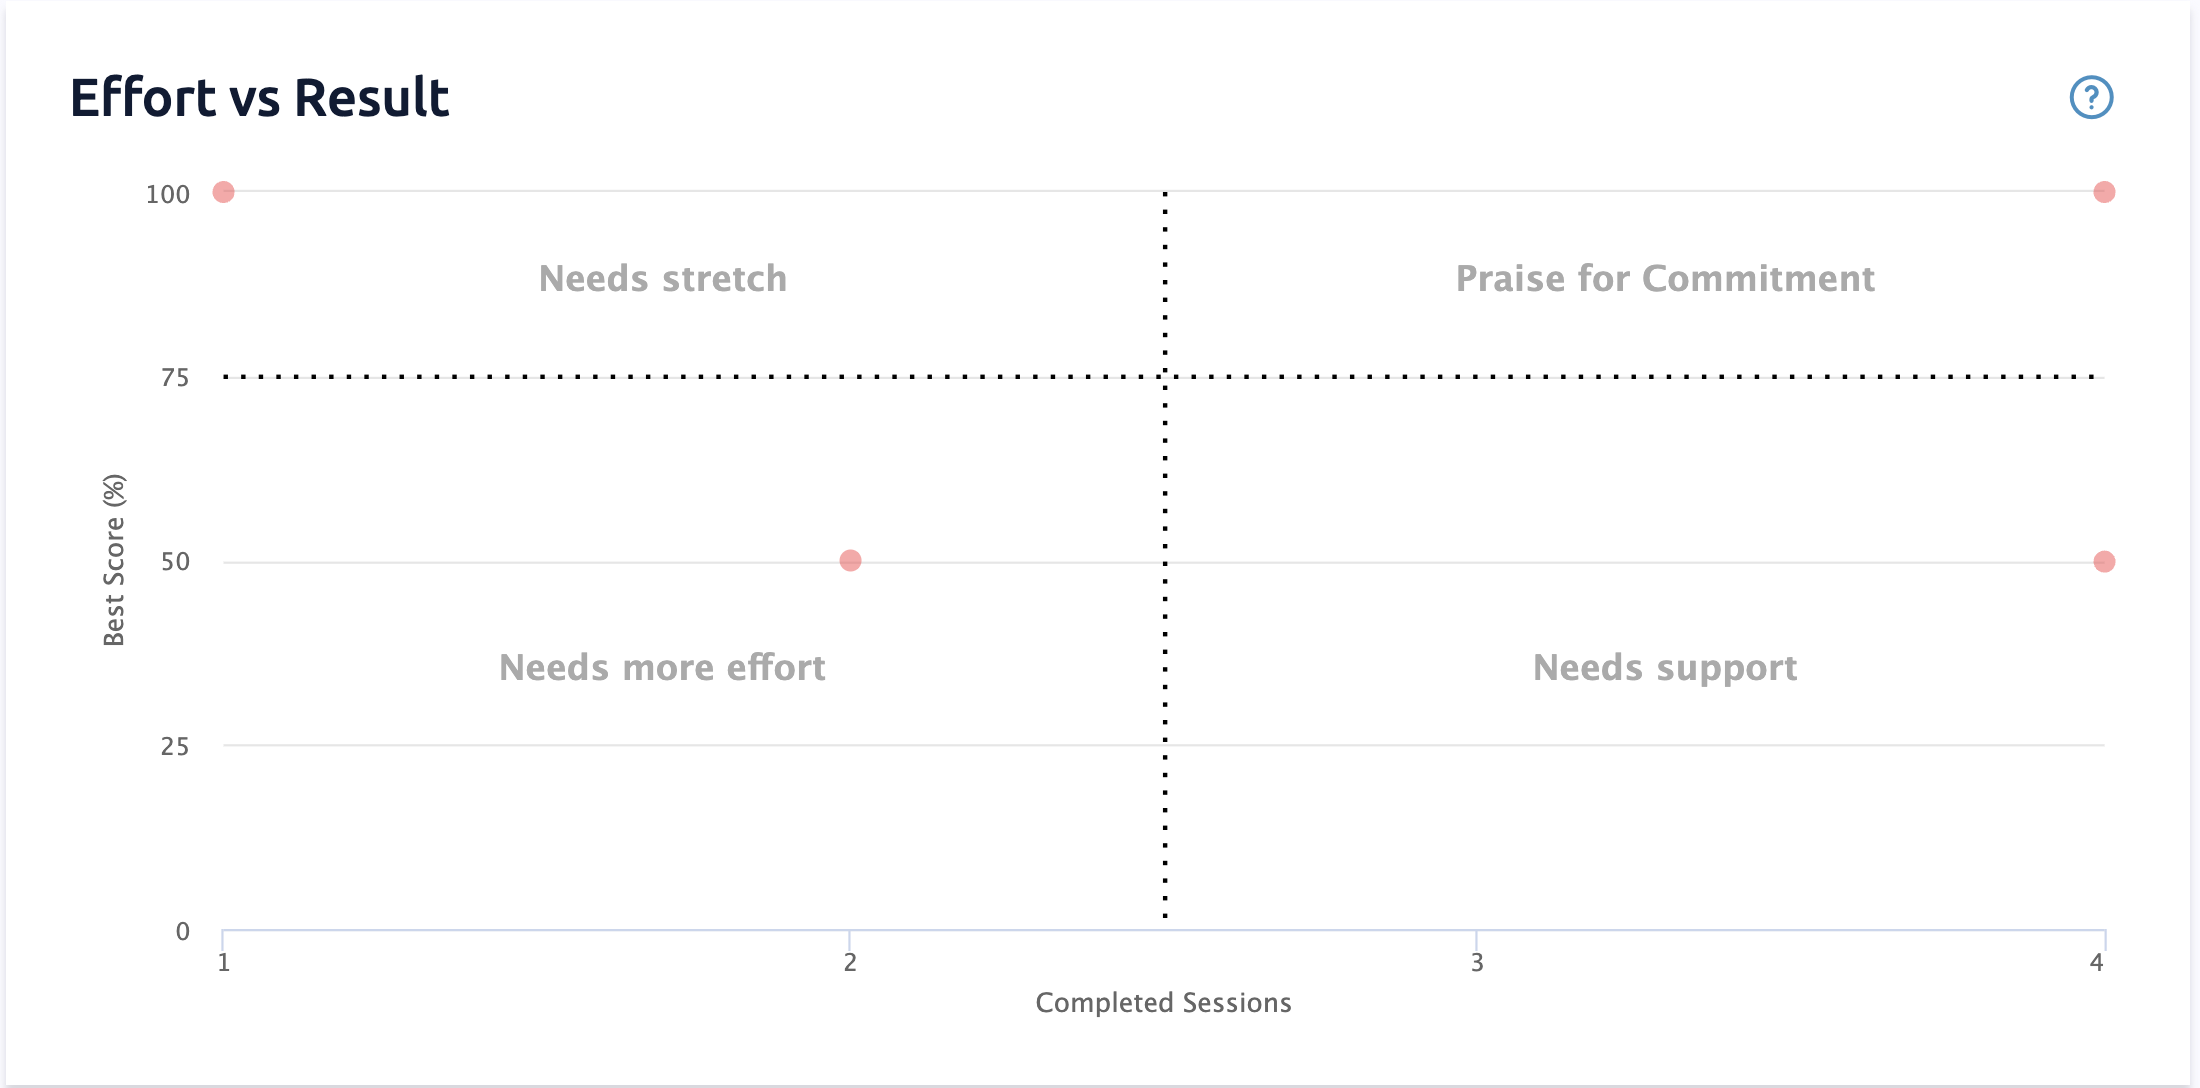
The Effort vs Result In this chart, learners are plotted according to their top score, and how many Completed Sessions they have taken to achieve that score.
Praise for Commitment
Learners who have achieved high scores, and have completed the training many times. These learners deserve credit for putting effort in to achieve a high score.
Needs Stretch
Learners who have achieved high scores, and have only completed the training a few times. These learners may need more of a challenge.
Needs More Effort
Learners who have received low scores, but have only completed the training a few times. They might need to try again to boost their scores.
Needs Support
Learners who have received low scores, and have completed the training many times. They might need some help to understand the content and receive better scores.
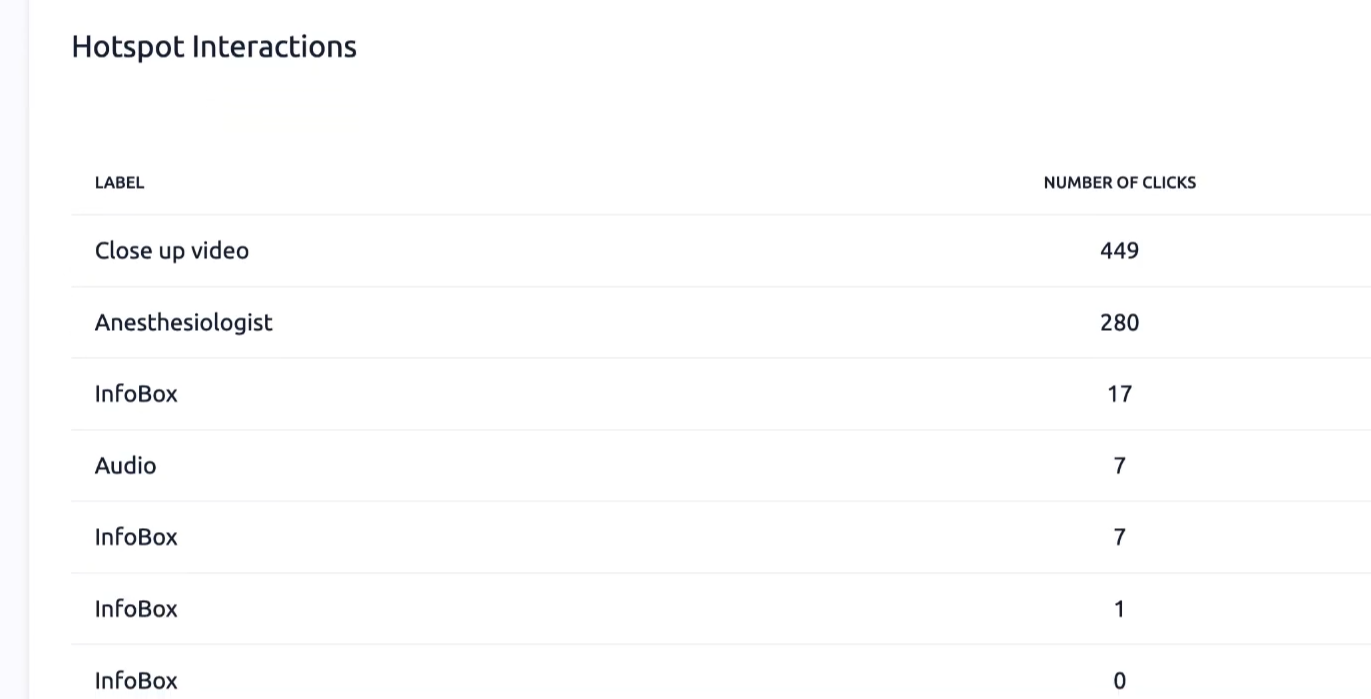
In the Interactivity tab, you will find interactions data showing how many times each of your interaction points has been hit & question response data which is a view of how your learners are performing within each question. In the example above, only about 37% of the learners are answering this question correctly. This may mean that either the question is too difficult, or that your students need more support prior to being assessed.
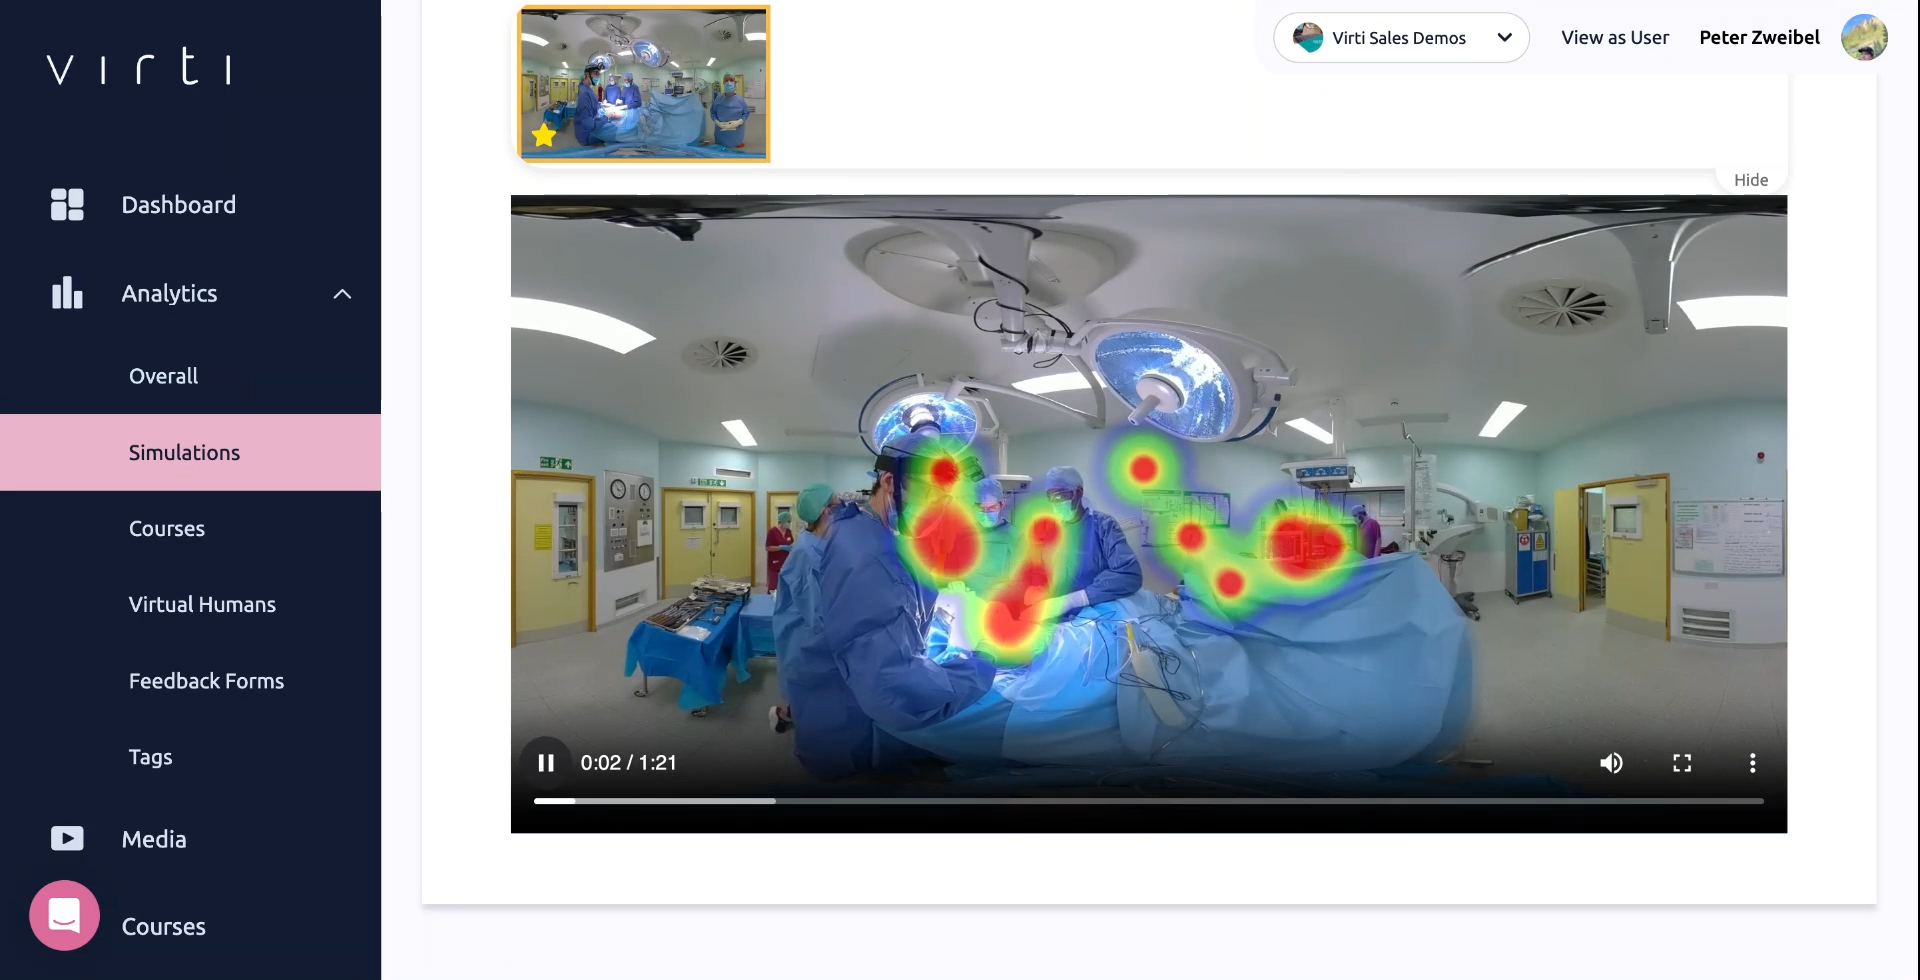
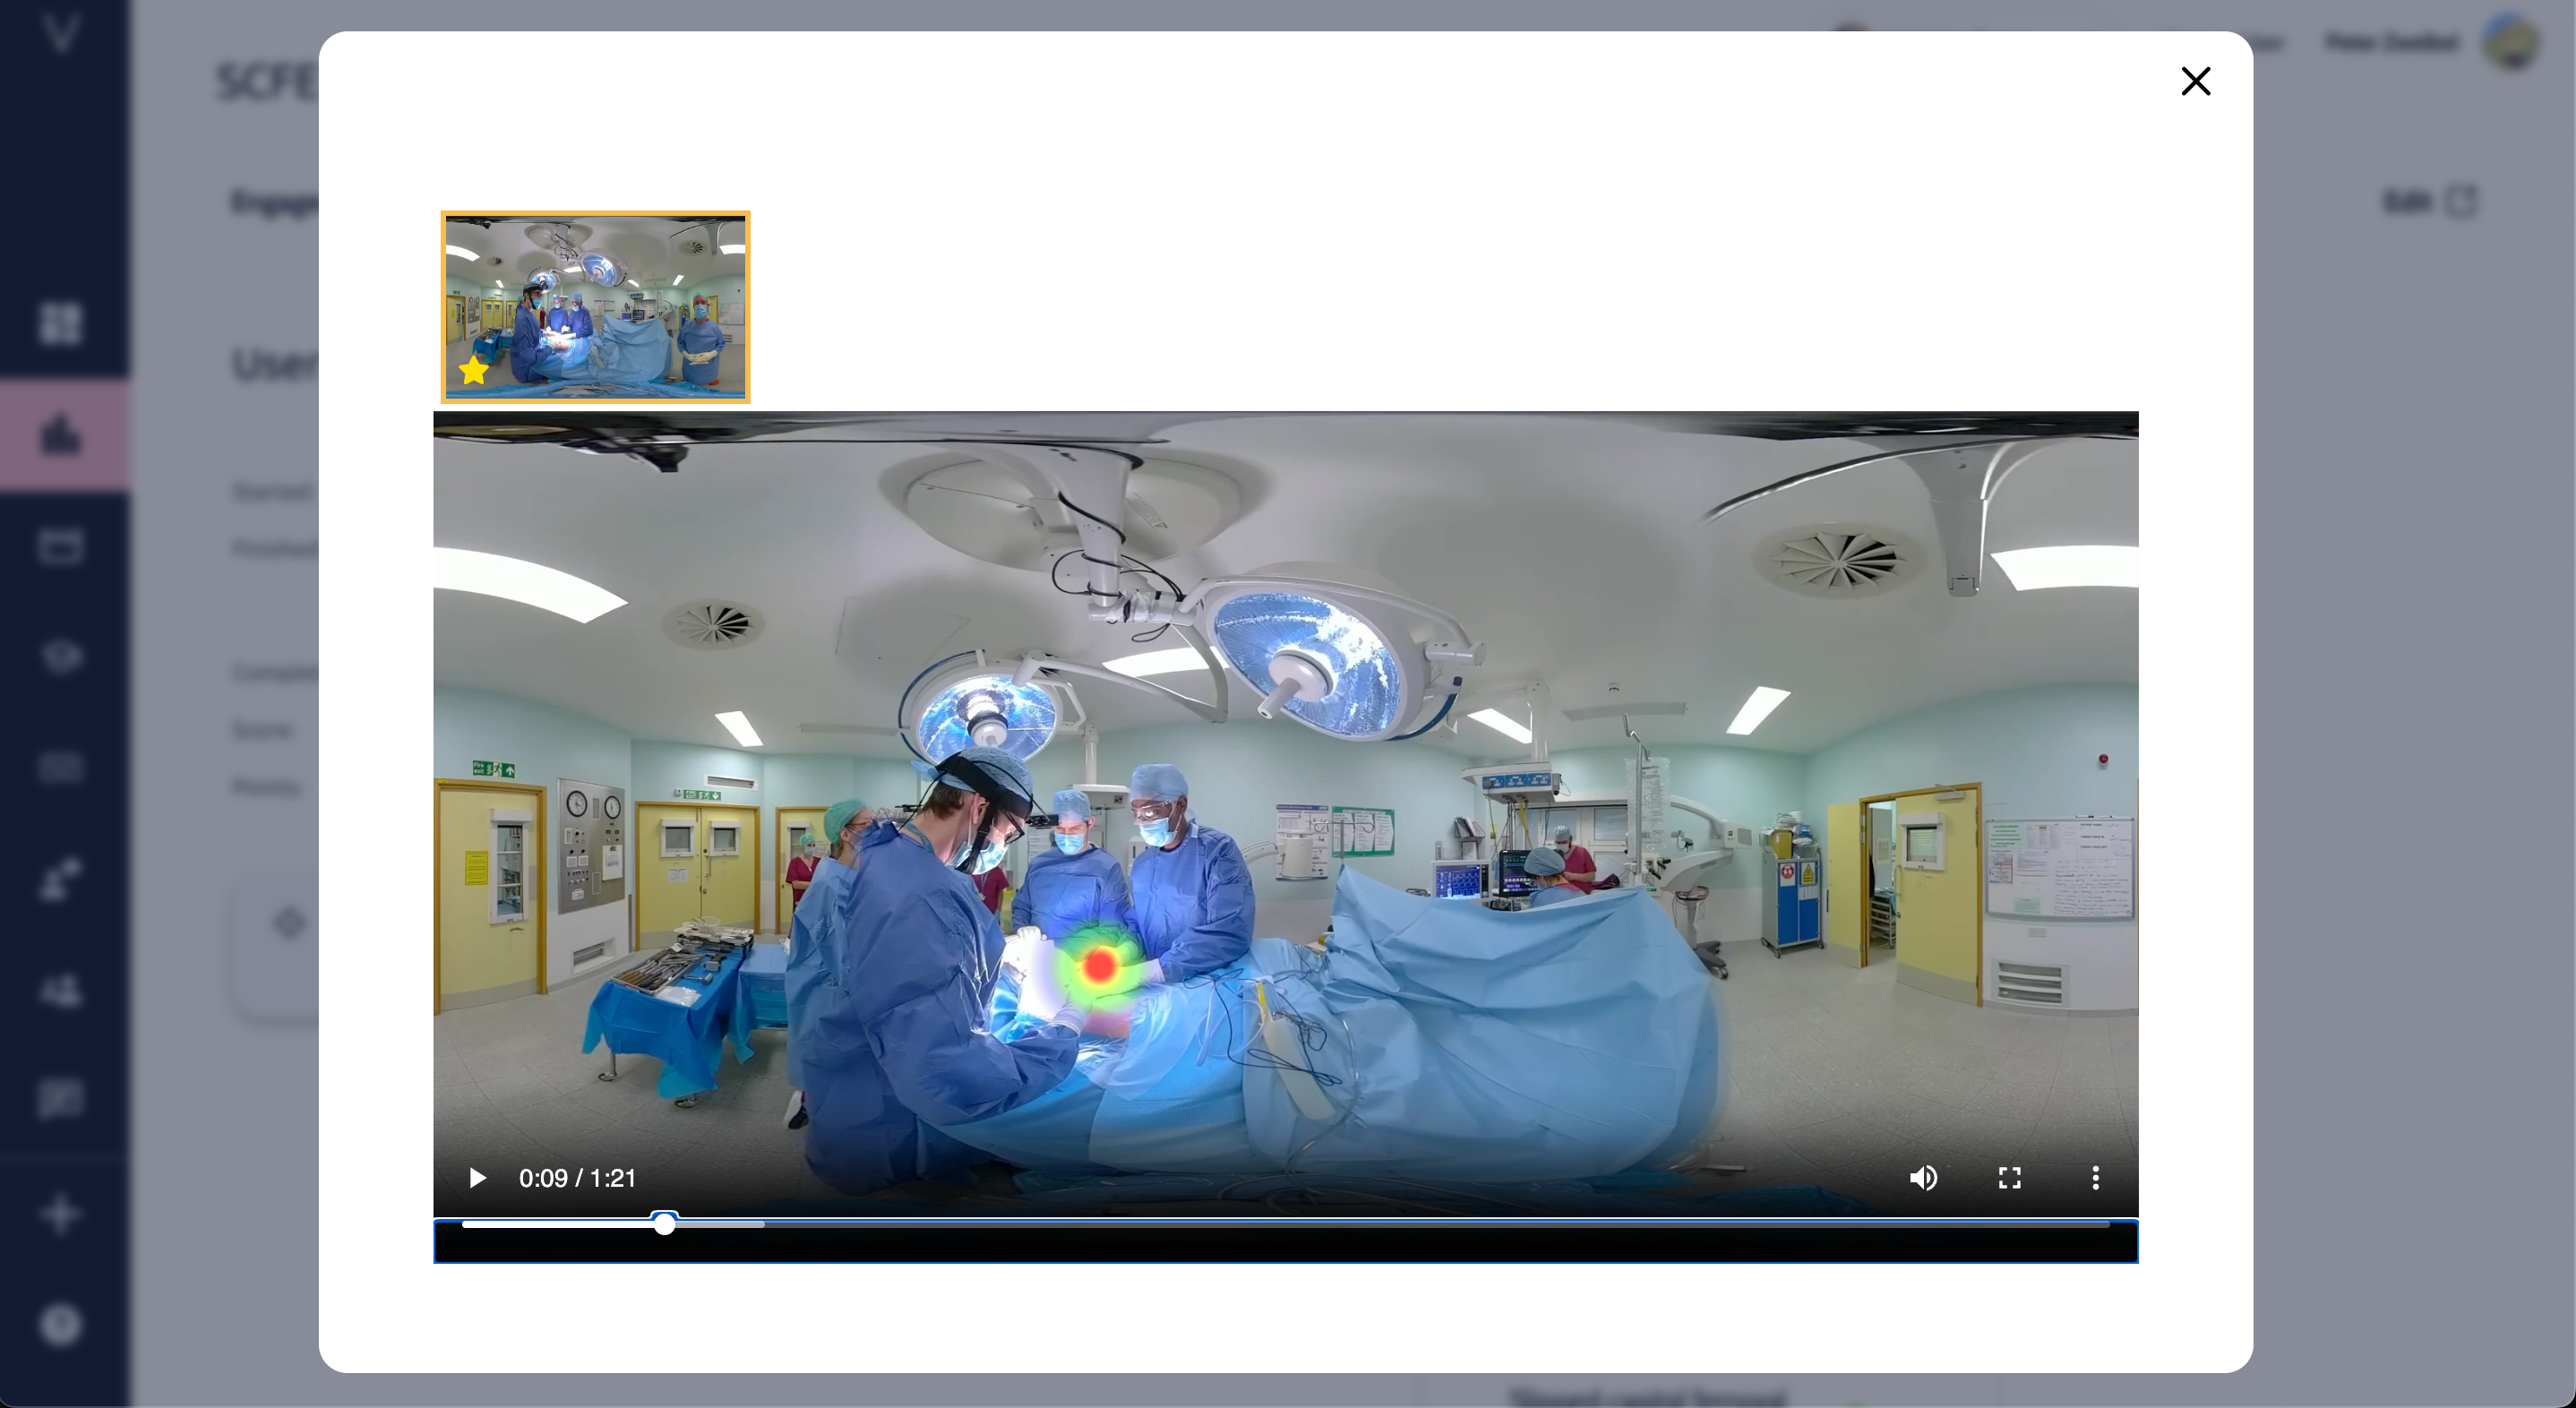
In the Heatmaps tab, you will be able to see an aggregate representation of where your learners were looking during each video. The data is based on the center of the user's gaze. This can be used to ensure the majority of your learners are looking where they should be, or identify potential distractions that are grabbing your learners attention.
In the Sessions tab, you will be able to see the individual sessions completed by each learner. This allows you to dive into the simulation, and review it with the learner to provide important feedback.
Click on the page icon to view a session log.
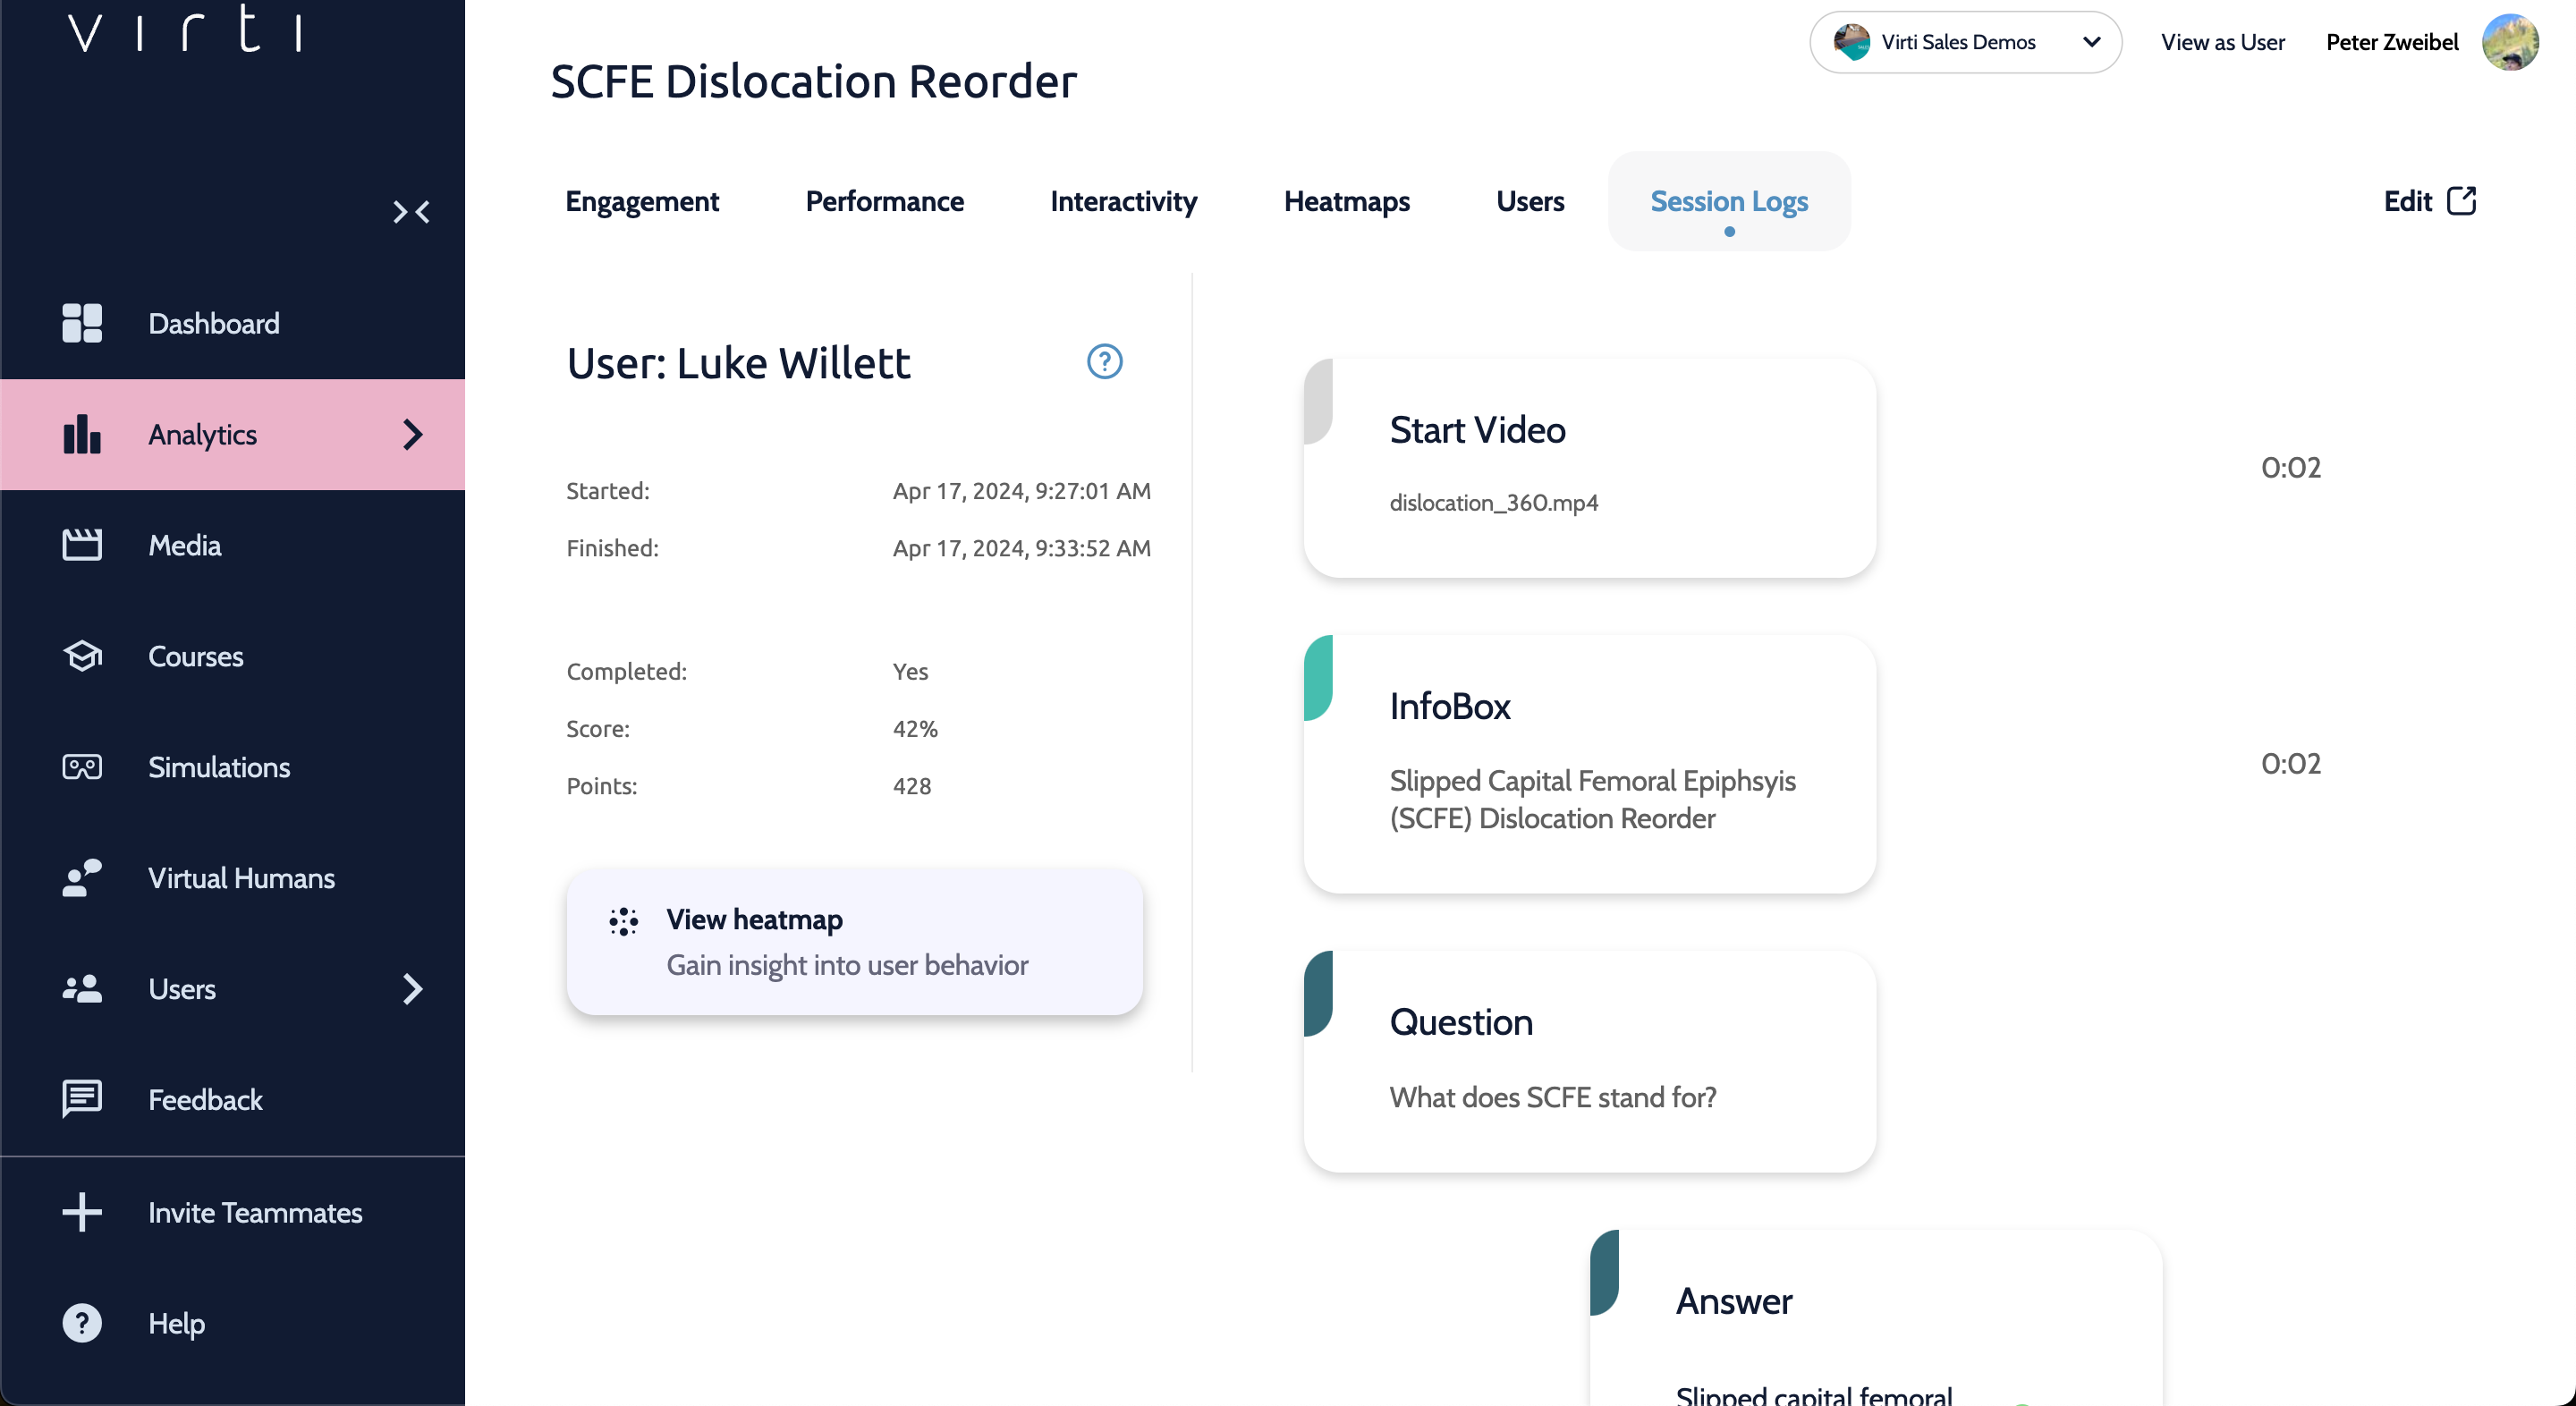
Hit View heatmap to see a representation of where this learner was looking during each video in the session.
To dive deeper in to your data, check out these guides:
Need more help? Contact [email protected]