In this article, you'll learn how to capture debugging logs using the Chrome browser, which can be shared with the support team to expedite issue resolution.
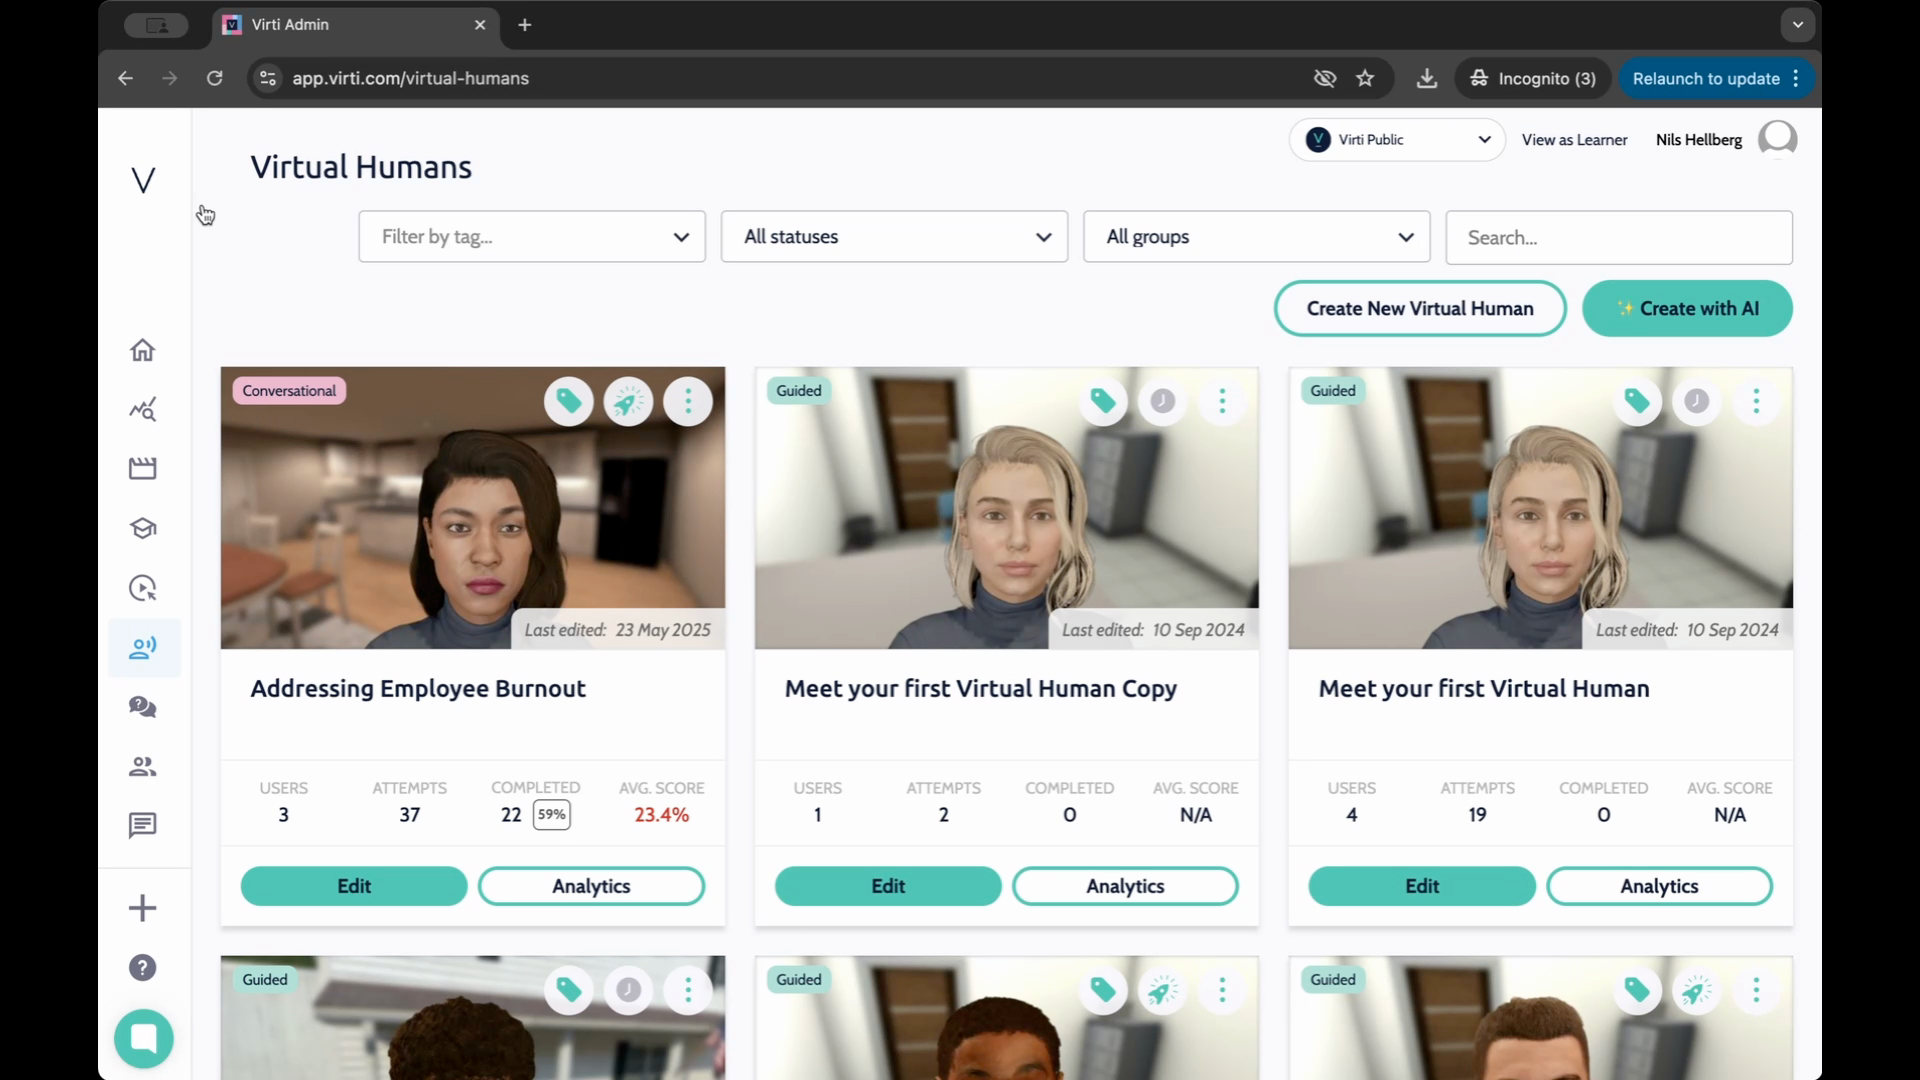
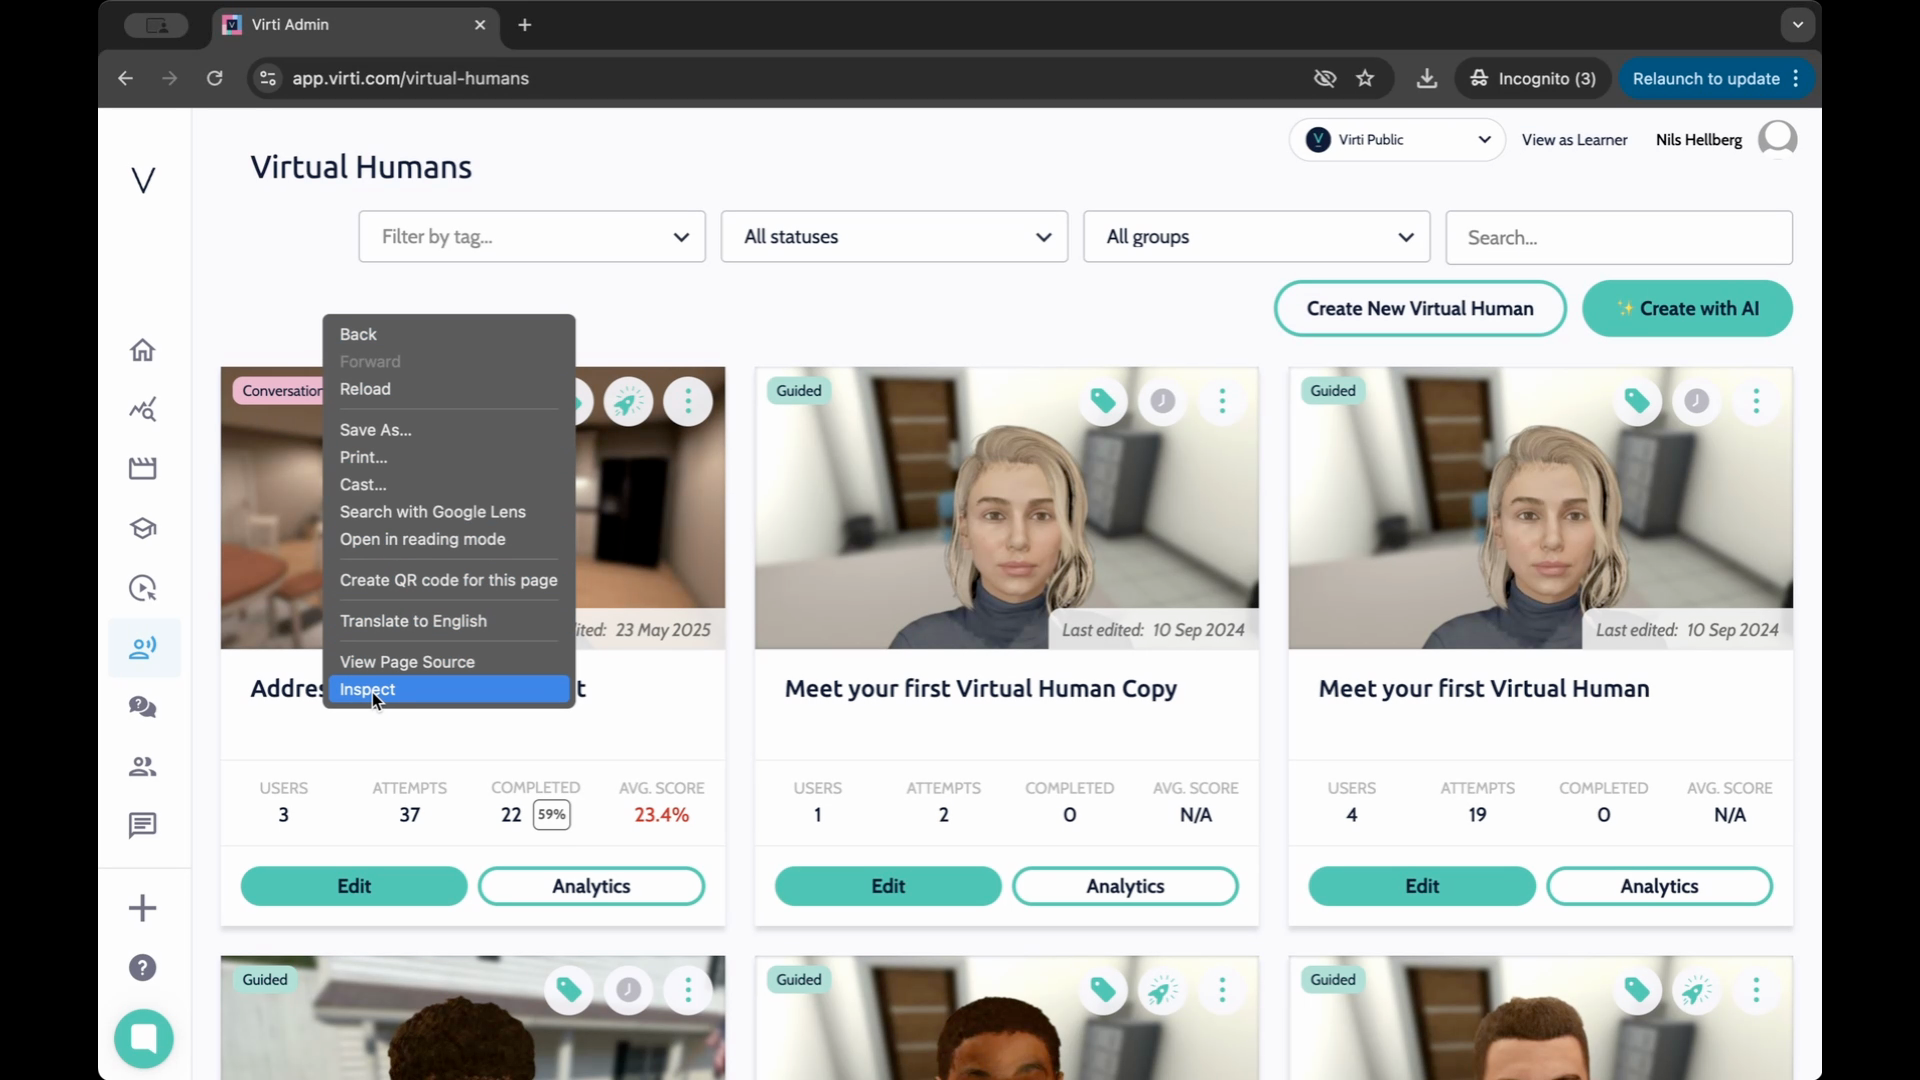
Step 1: Open the Chrome browser and launch the developer tools. You can do this by pressing F12 or right-clicking anywhere on the site after logging in and selecting Inspect.
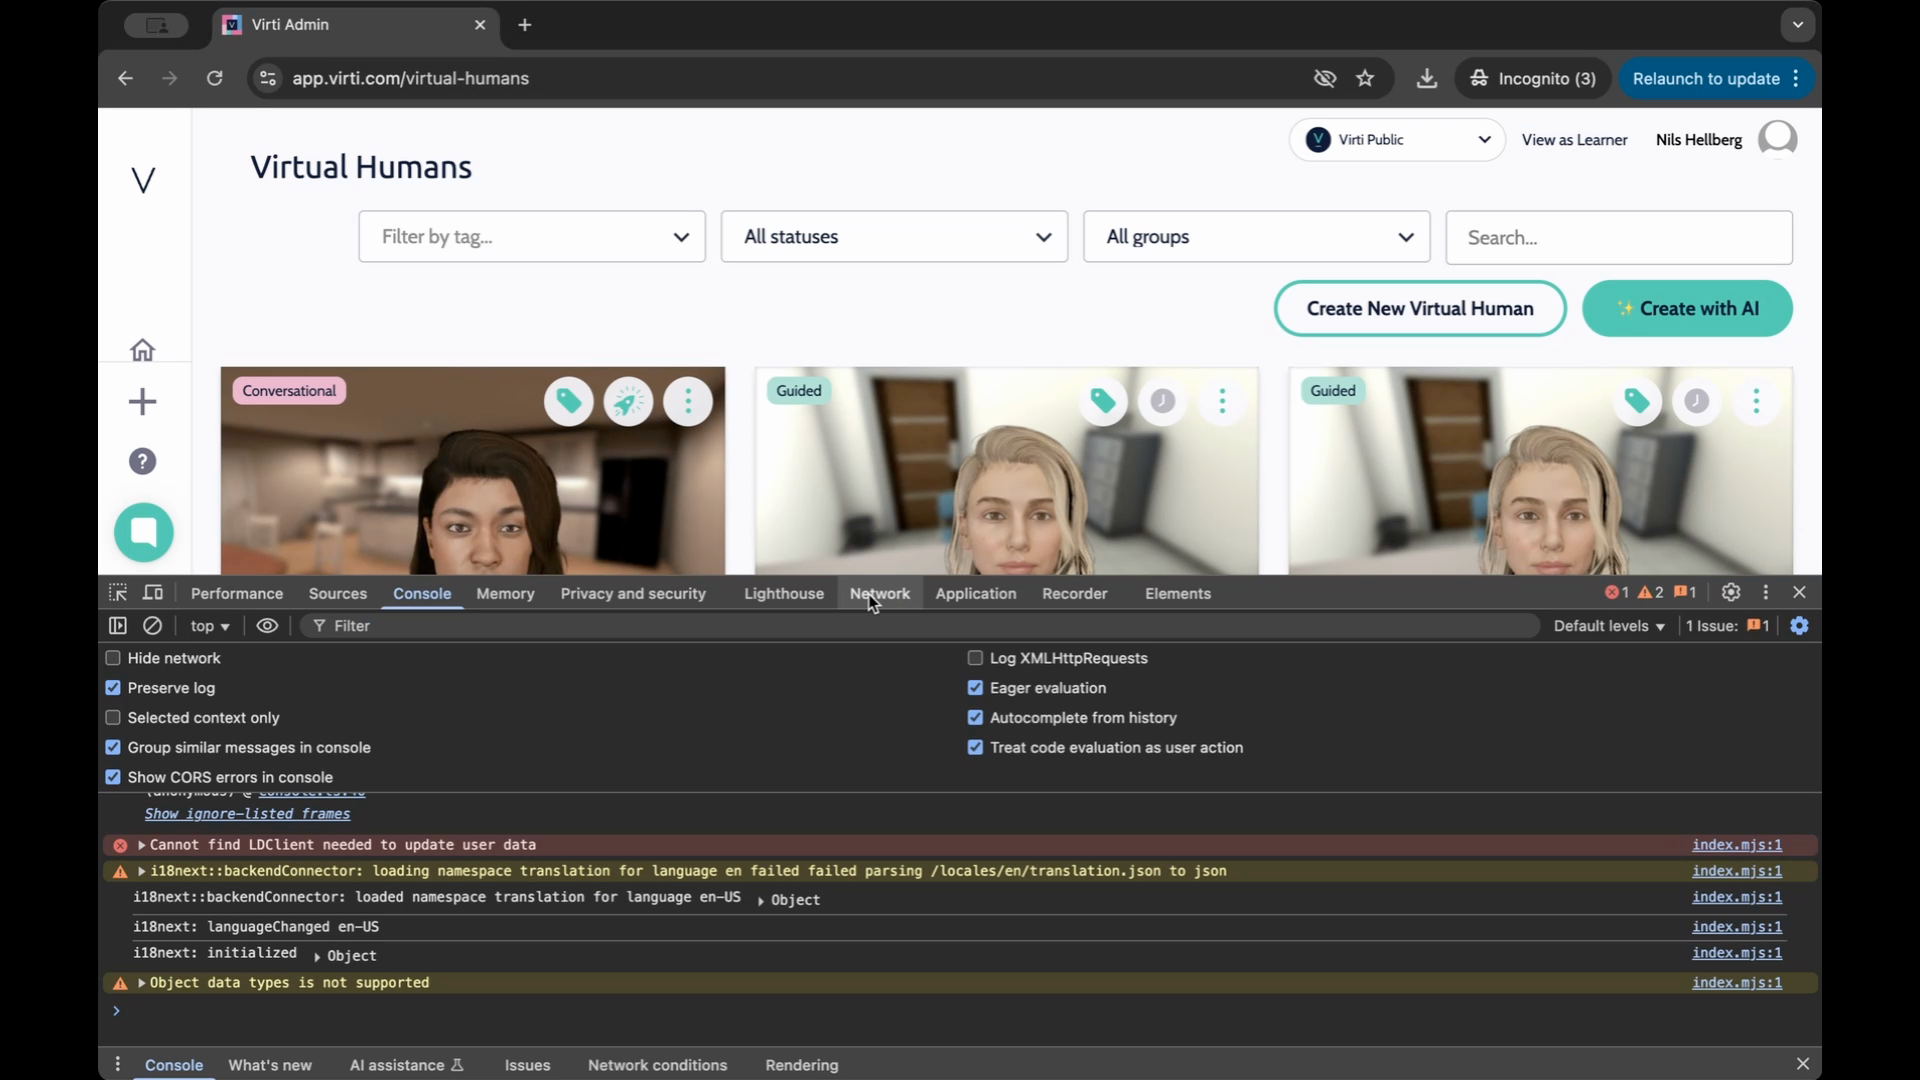
Step 2: The developer tools might open in a separate window or docked to the browser window.
Step 3: Navigate to the Console tab. This tab displays various activities happening on the website.

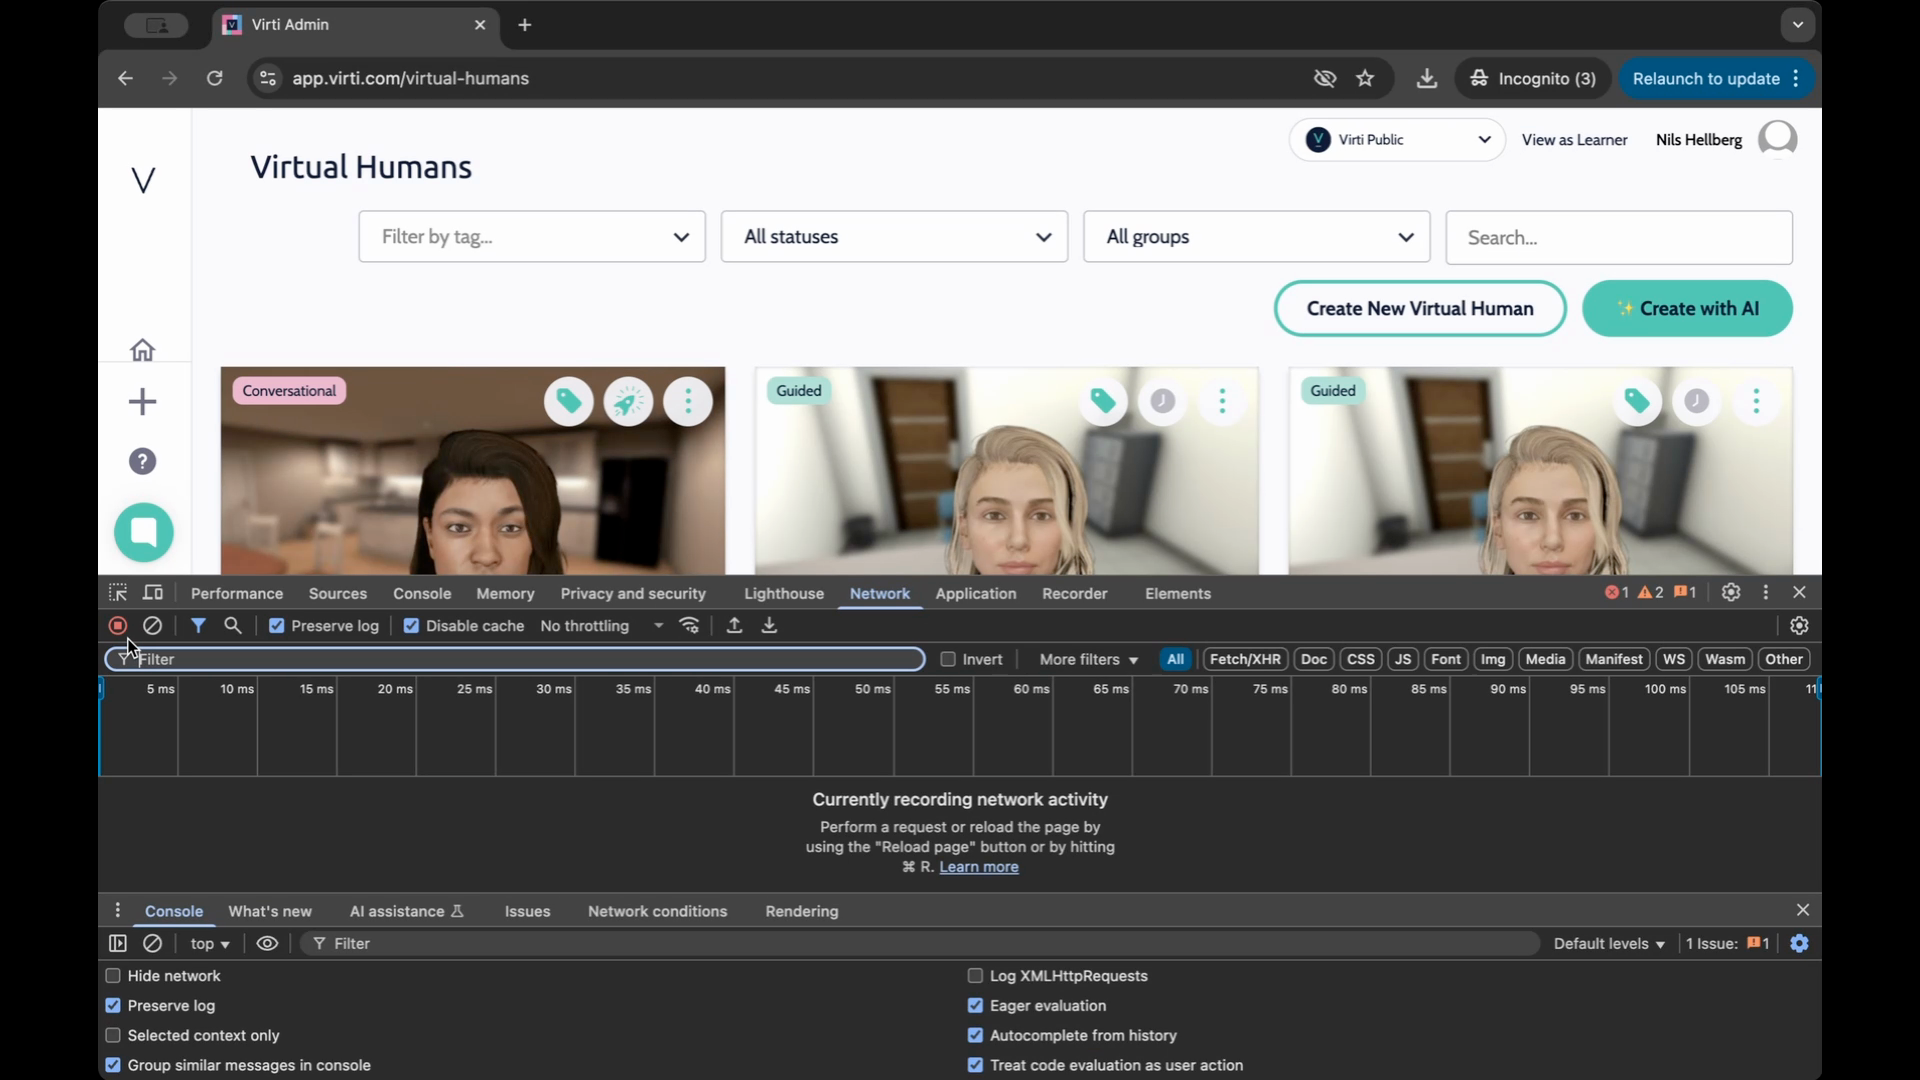
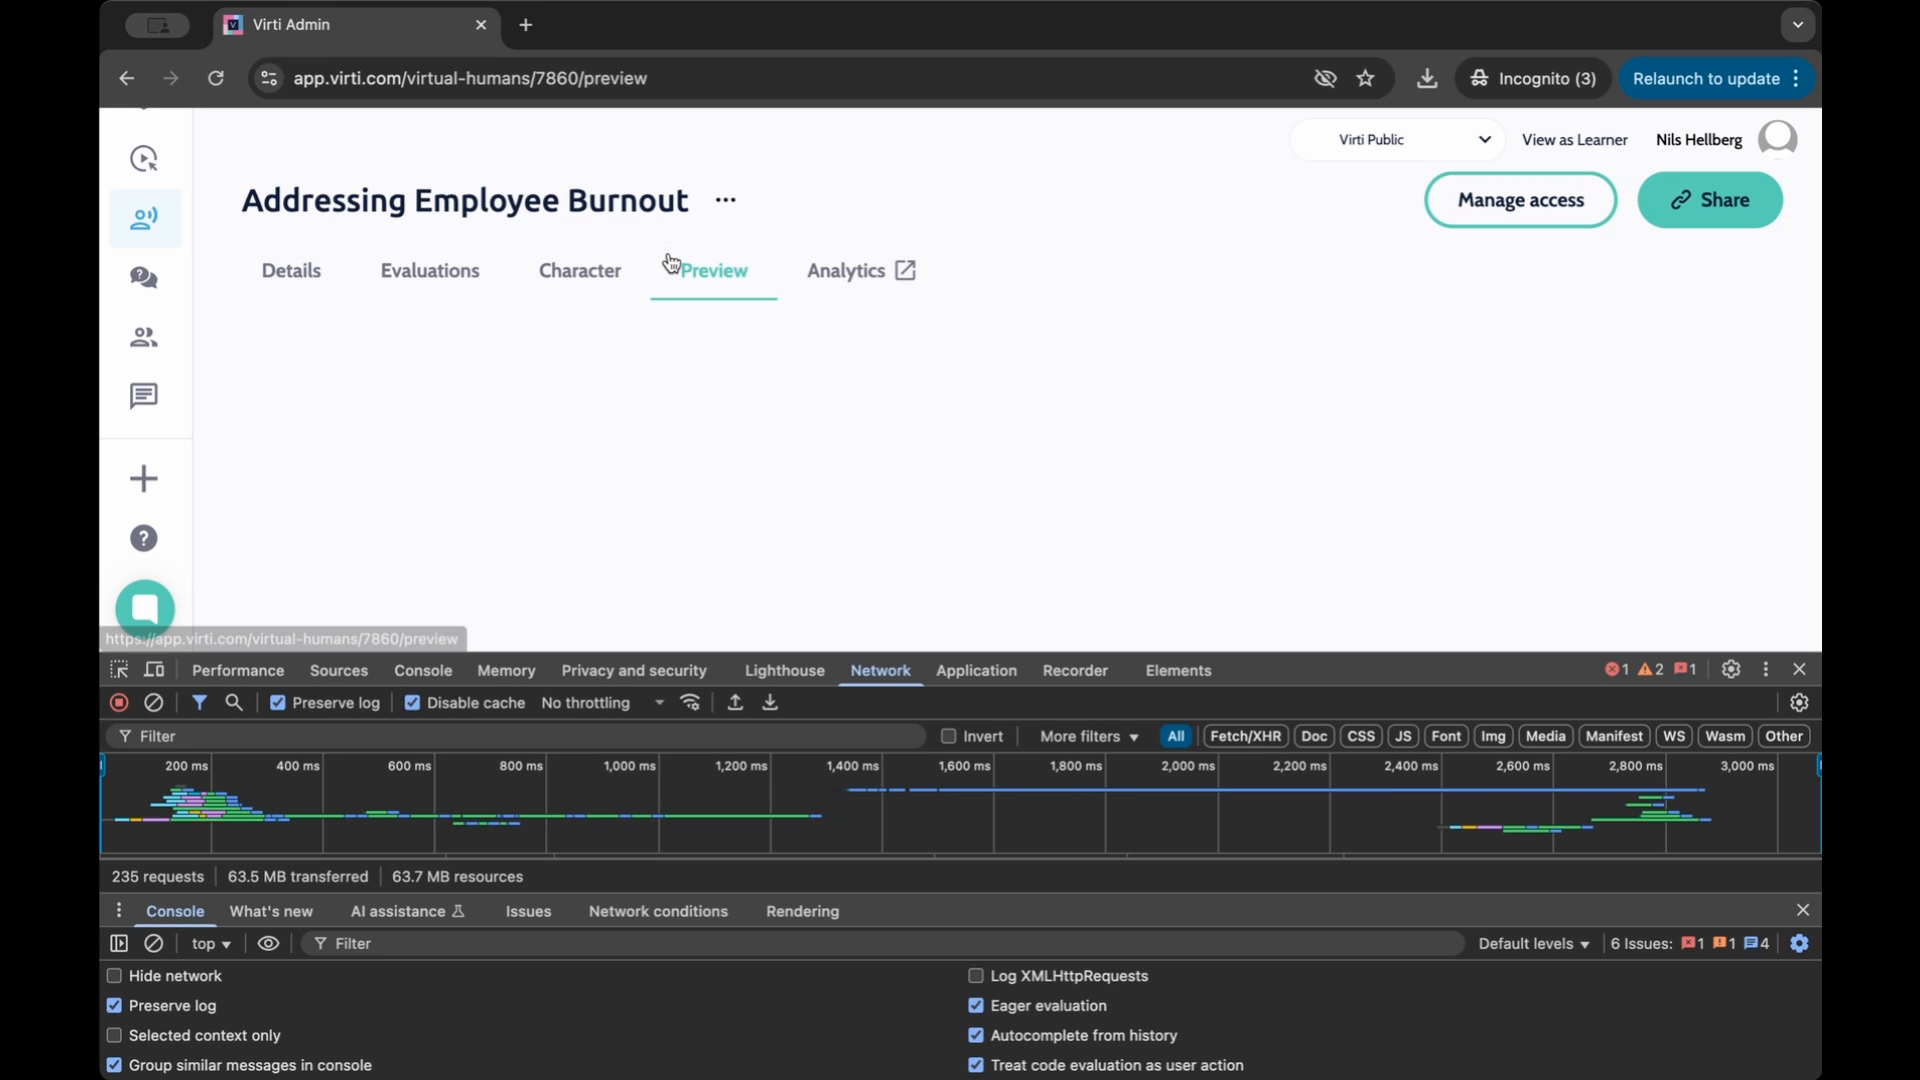
Step 4: Open the Network tab. This tab shows any requests made by the web application.
Step 5: Ensure the recording icon is red, indicating that it's recording.
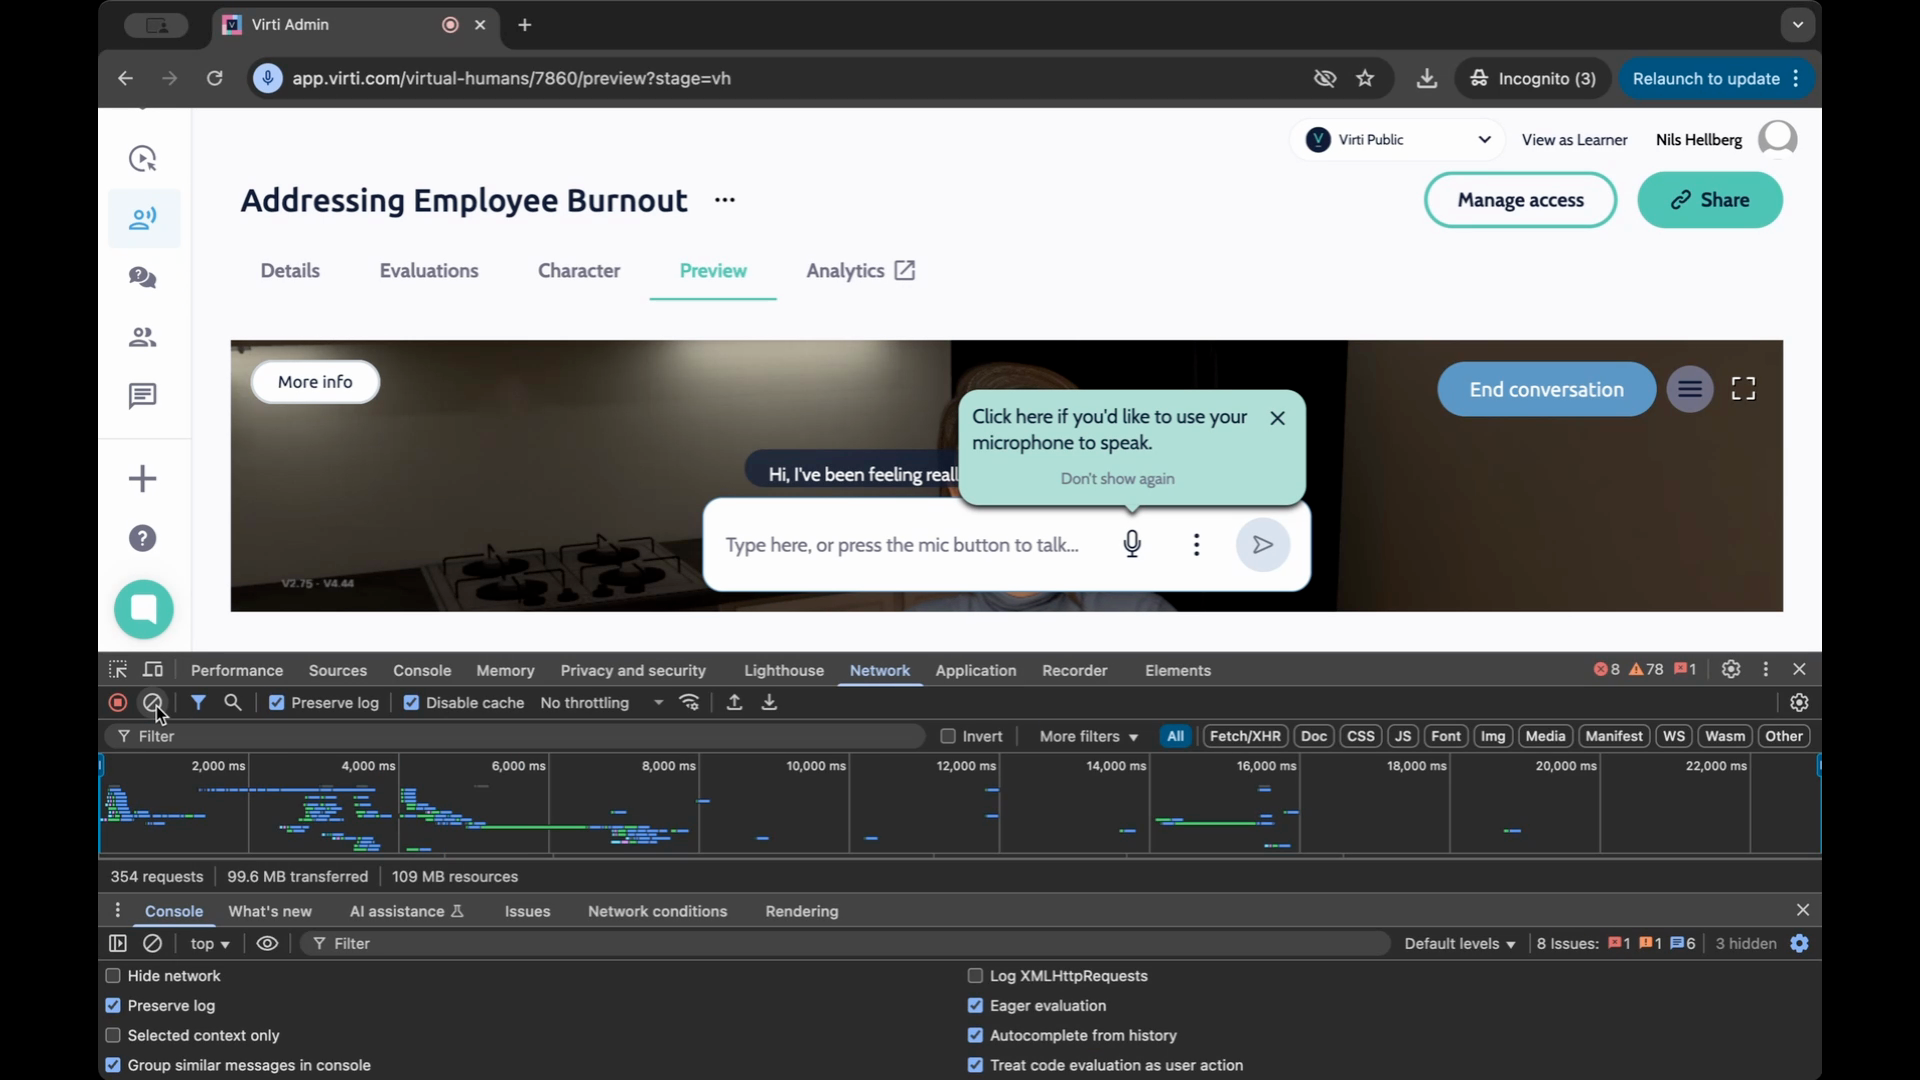
Step 6: Recreate the issue within the web application. For example, if the issue occurred while previewing a virtual human, click on the preview and let everything load as normal.
Step 7: Once you've recreated the issue, return to the Network tab and click Stop to end the recording.
Step 8: To save the recorded information, click on the icon with the downward arrow labeled export har. Save this file anywhere on your computer.
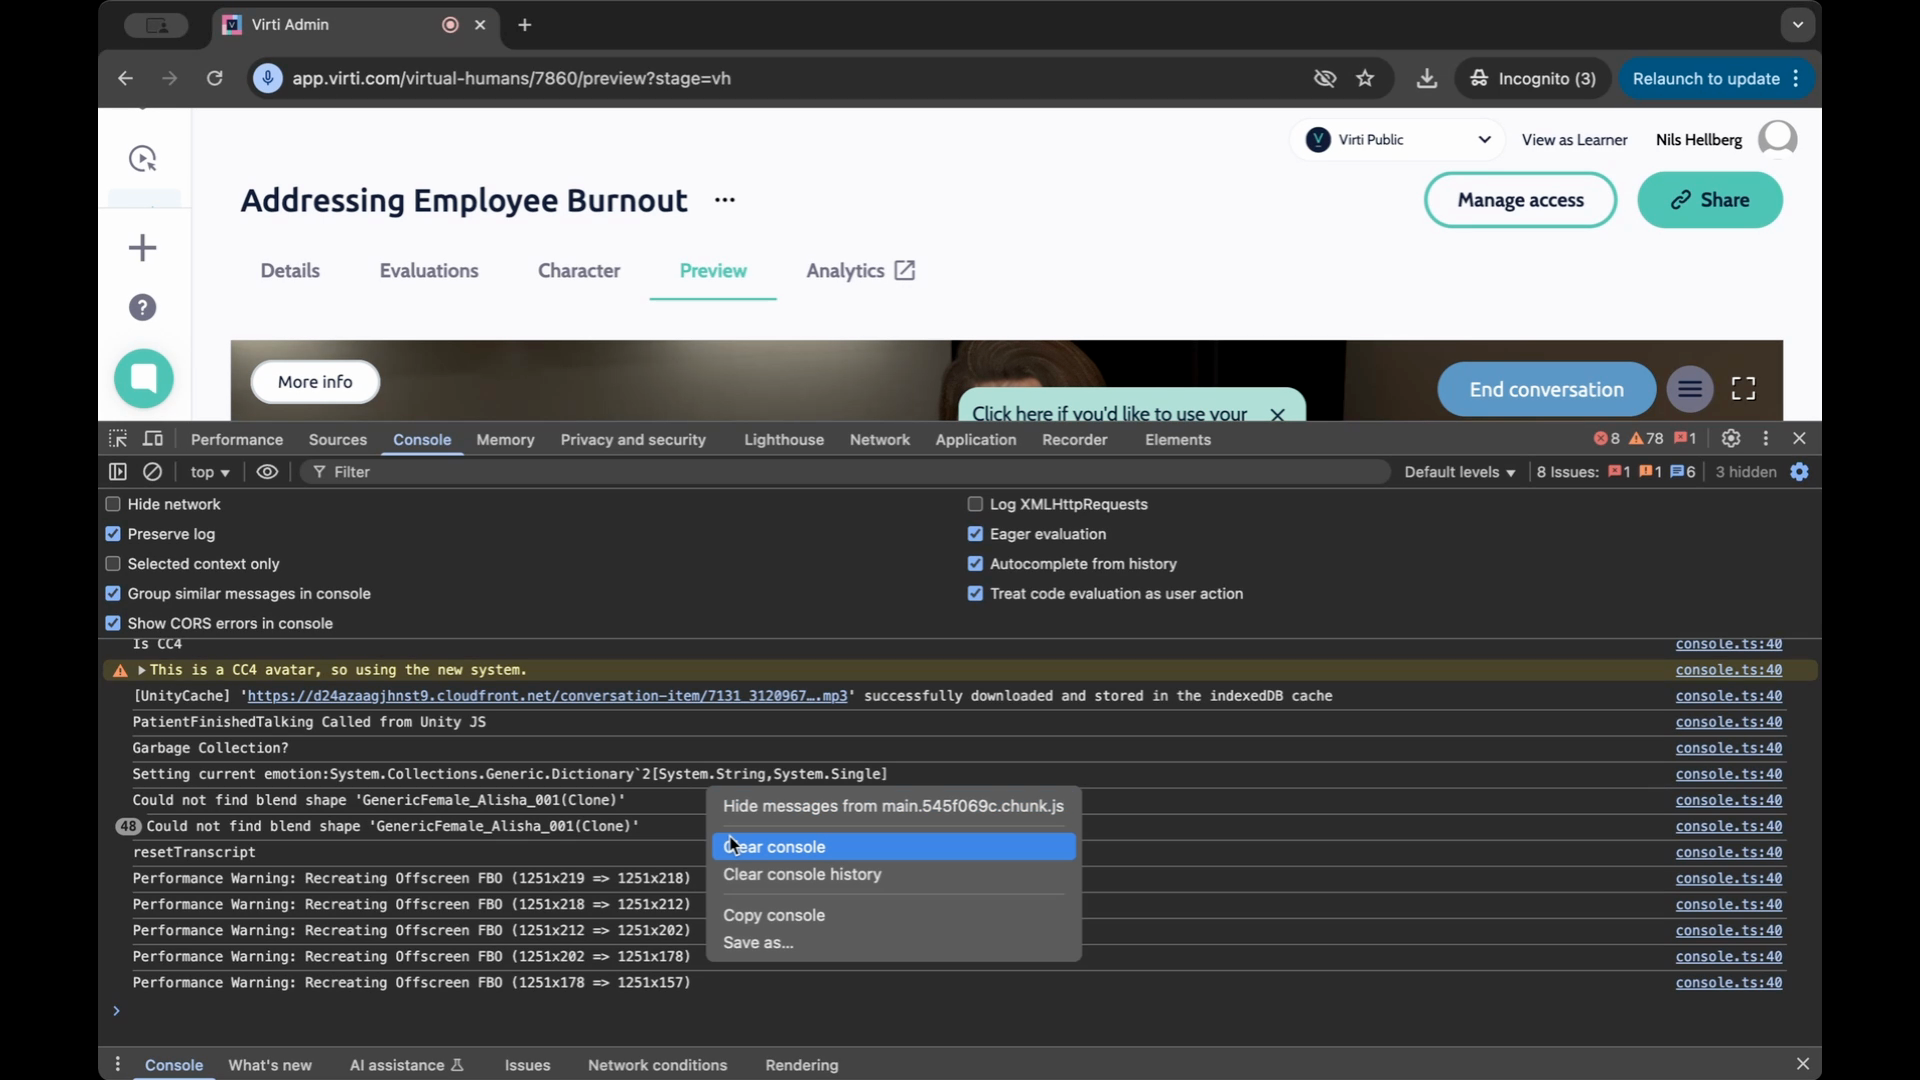
Step 9: In the Console tab, right-click anywhere and select Save as. Save this as a log file.
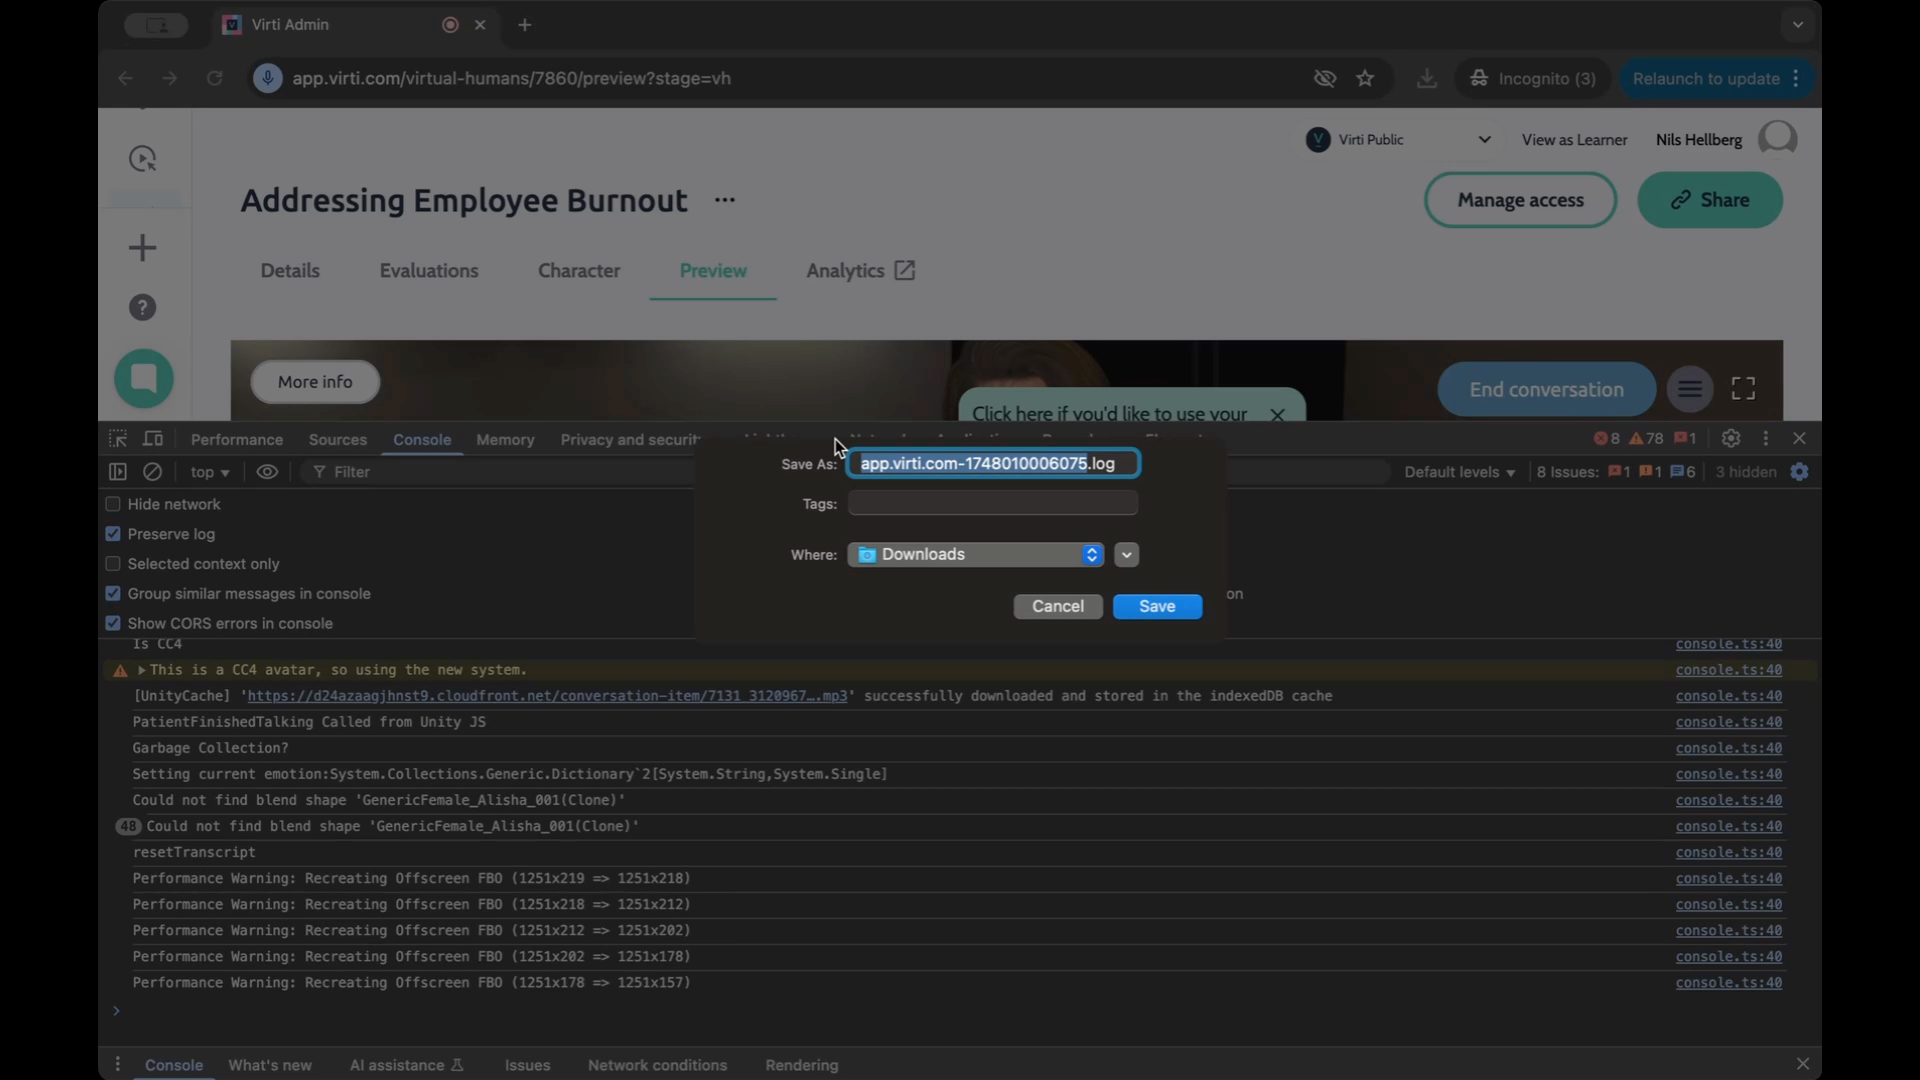
By following these steps, you'll have two files - an HRL file and a log file. These can be shared with the support team to help them debug any issues that arise in the web application.